Transcription of A˜n Hwang Select Balanced Fund
1 A n Hwang Select Balanced FundInterim Report30 September 2015 TRUSTEEHSBC (Malaysia) Trustee Berhad (1281-T)MANAGERA n Hwang Asset Management Berhad (429786-T)1 AFFIN Hwang Select Balanced fund Interim Report and Unaudited Financial Statements For the 3 Months Financial Period Ended 30 September 2015 Content Page MANAGER S REPORT .. 2 fund PERFORMANCE DATA .. 7 TRUSTEE S REPORT .. 8 STATEMENT OF COMPREHENSIVE INCOME .. 9 STATEMENT OF FINANCIAL POSITION .. 10 STATEMENT OF CHANGES IN EQUITY .. 11 STATEMENT OF CASH FLOWS .. 12 SUMMARY OF SIGNIFICANT ACCOUNTING POLICIES .. 13 NOTES TO THE FINANCIAL STATEMENTS .. 21 STATEMENT BY THE MANAGER .. 58 DIRECTORY OF SALES OFFICE .. 59 2 MANAGER S REPORT (1) MANAGER S VIEW ON PORTFOLIO AND MARKET fund Type, Category, Objective and Distribution Policy Affin Hwang Select Balanced fund (the fund ) is a growth and income fund categorized as Balanced fund that provides investors affordable access into a diversified investment portfolio containing a Balanced mixture of equities and fixed income securities to achieve a balance of growth and income over medium to long term.
2 The fund endeavours to distribute income, if any, on a semi-annual basis. However, the amount of income available for distr ibution may fluctuate from year to year. Benchmark The benchmark used by the Manager in measuring the performance of the fund is a weighted average of the FTSE Bursa Malaysian Top 100 Index (FBM 100) performance (for equity investment) and current Maybank 12-month Fixed Deposit Rate*. If current Maybank 12-month Fixed Deposit rate is , the benchmark for fixed income securities would be The weightings assigned are in the proportion of 50:50. For example, if the FTSE 100 Index was to return 10% during the year and given the above Fixed Deposit rate, the benchmark s return for the fund would be (50% x ) + (50% x 10%). * The risk profile of this fund is different from the risk profile of the benchmark. Performance of the fund (1 July 2015 to 30 September 2015) For the period from 1 July 2015 to 30 September 2015, the fund registered a return of The fund outperformed the Benchmark by compared to the Benchmark return of for the same period.
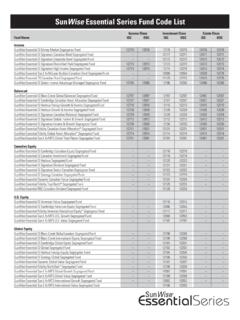
3 (See Table 1 for performance of the fund and Figure 1 for movement of the fund versus the Benchmark respectively). The Net Asset Value (NAV) per unit of the fund as at 30 September 2015 was while the NAV per unit as at 30 June 2015 was Since commencement, the fund has outperformed the benchmark by with returns of compared to the benchmark return of The fund has declared a total gross income distribution of per unit to date. As such, the objective of the fund which is to provide investors with a mixture of income and capital growth is being met. Table 1: Performance of the fund For the Period (1/7/15 - 30/9/15) 1 Year (1/10/14 - 30/9/15) 3 Years (1/10/12 - 30/9/15) 5 Years (1/10/10 - 30/9/15) Since Commencement (18/8/03 - 30/9/15) fund ( ) ( ) Benchmark ( ) ( ) Outperformance /(Underperformance) Source of Benchmark: Bursa Malaysia Berhad & Maybank 3 Table 2: Average Total Return 1 Year (1/10/14 - 30/9/15) 3 Years (1/10/12 - 30/9/15) 5 Years (1/10/10 - 30/9/15) Since Commencement (18/8/03 - 30/9/15) fund ( ) Benchmark ( ) Outperformance Source of Benchmark: Bursa Malaysia Berhad & Maybank Table 3: Annual Total Return FYE 2015 (1/7/14 - 30/6/15) FYE 2014 (1/7/13 - 30/6/14) FYE 2013 (1/7/12 - 30/6/13) FYE 2012 (1/7/11 - 30/6/12) FYE 2011 (1/7/10 - 30/6/11) fund Benchmark ( ) Outperformance Source of Benchmark: Bursa Malaysia Berhad & Maybank Figure 1.
4 Movement of the fund versus the Benchmark This information is prepared by Affin Hwang Asset Management Berhad for information purposes only. Past earnings or the fund s distribution record is not a guarantee or reflection of the fund s future earnings/future distributions. Investors are advised that Unit prices, distributions payable and investment returns may go down as well as up. Source of Benchmark is from Bloomberg. Benchmark: FTSE Bursa Malaysian Top 100 Index (FBM 100) performance (for equity investment) and current Maybank 12-month Fixed Deposit Rate Investment Strategy (1 July 2015 to 30 September 2015) Equity: The Manager had reduced the portfolio s equity exposure over the period under review amid the growing volatility in the market. The equity exposure was reduced from to as at the end of September 2015. Given the uncertainties backed by the slowdown in the growth China s economy along with the weakening of Emerging Market currencies, the Manager reduced the fund s exposure into the equity market and maintained relatively higher cash holdings as a defensive measure.
5 Fixed Income: The fund held an exposure of approximately 47% into fixed income instruments as at the end of September. Yields were generally stable over the period under review until August. The uncertainties in the timeline of the US Federal Reserve rate hike, and a surprise devaluation of the Renminbi (RMB) by 4 the People s Bank of China (PBoC) dragged down investors sentiment and nudged yields higher. Given the on-going volatility and thin liquidity in the market, the Manager expects to maintain a shorter duration for its fixed income exposure, while bottom-up credit selection will continue to be key consideration for portfolio construction. The Manager had also maintained a hedging policy on fund s fixed income exposure to mitigate foreign currency risk for the portfolio given the volatile currency movements. Asset Allocation As at 30 September 2015, the asset allocation of the fund stood at 43.
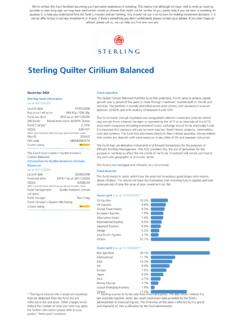
6 93% in equities, 47 .93% in fixed income securities, and the balance of 8. 14% in cash. For a snapshot of the fund s asset allocation as at 30 September 2015, refer to Figure 2. Figure 2: Summary of Asset Allocation Sector Allocation 30 Sept 2015 % 31 Dec 2014 % 31 Dec 2013 % Equities - local Oil and Gas Consumer Services - - Consumer Goods - - Financial Industrial - - REITs - Telecommunications - - Utilities - Warrants - - Consumer Products - Construction - Trading / Services - Properties - Plantation - Industrial Products - - Infrastructure Project Companies - - Equities - foreign Consumer Services - - Financials Technology - - Industrial - - Telecommunications - Consumer Goods - - REITs - Healthcare Facilities - Services - Basic Industry & Chemicals - Consumer Products - - Marine Transportation - - Agriculture - Property & Real Estate - - Manufacturing - - Properties - - Fixed Income Securities - local Fixed Income Securities - foreign Cash Total The equities
7 Allocation for the fund was reduced to from in the previous year. This is due to the heightened market volatility over the period under review. On the fixed income side, allocations to the bonds have been increased to 5 Market Review (1 July 2015 to 30 September 2015) Equity: Concerns surrounding the pace of global growth had remained a key concern for global markets. While US had continued to release generally satisfactory economic data that suggested its economy may well be back on track, China was seen to be on a different route. Weak economic data backed by the decline in MSCI Asia ex-Japan Index of has signalled the slowing growth in China and the Emerging Markets. Markets which had rejoiced in the stimulus measures that the People s Bank of China (PBoC) had continued to roll out to provide support for its ailing economy took a turn after the PBoC took the decision to devalue its currency. Investors viewed the move as a potential threat for a currency war, fearing other economies doing the same to boost its export growth.
8 The Shanghai Composite Index took the brunt of the hit as investors shied away from the market the index substantially slipped in MYR terms over the period under review. Most regional currencies continued to suffer in the face of US Dollar strength in anticipation of the impending rate hike by the US Federal Reserve. This contributed to investors shifting funds away from the region which contributed to the weakness of the broader equity market. The FTSE Bursa Malaysia KLCI shed 5% in the period under review, and remained one of the weaker performing markets among its peers. Fixed Income: The US Dollar continued to see an uptrend over the period under review, especially against the Emerging Markets. Encouraging data flowing out of the US, along with the anticipated rate hike by the US Feds remained a support driver for the currency. fund flows moving back into the US had driven dem and for bonds and dragged down yields.
9 The heightened uncertainties surrounding global financial markets led to further broad-based rise in yields for global bonds. The volatility has led to the US high yields being one of the worst performing segments, alongside Emerging Market debt. The 10-year US Treasury yields held on steadily to close the period at China continued its loosening monetary policy by lowering its 1-year lending rate by a quarter of a percentage point to and its 1-year deposit rate by the same scale to 2% in a bid to stabilise its market, adjust structures and lower social financial costs. China fell back on its major levers to stem the biggest stock market rout since 1996 and deepening slowdown, cutting interest rates for the fifth (5) time in 10 months since November. The PBoC is also expected to provide further liquidity into the market through the injection of an estimated RMB700 billion worth of liquidity into the banking system.
10 The growing signs that China s economy is struggling, coupled with the uncertainty over the direction of its policy makers took its toll on Asia s growth outlook. Meanwhile, mounting pressure faced by the domestic economy on the back of weak Ringgit, low oil prices and on-going political concerns had gradually nudged yields back up. Malaysian government bonds fell, pushing the 10-years yield to its highest since 2008. Investment Outlook Equity: Concerns for most investors remain on the repercussions to the end of the US zero interest rate policy. Especially for Emerging Markets, concerns of a similar reaction to the taper tantrums of last May (2013) have increased the number of investors. Speculation that US Federal Reserves will keep interest rates lower for a longer period of time and expectations for more policy support from the Chinese authorities is deemed to help the global equities.