Transcription of A Noise Map of New York City - microsoft.com
1 A Noise Map of New york city Abstract This demonstration presents a Noise map of New york city , based on four ubiquitous data sources: 311 complaint data, social media, road networks, and Point of Interests (POIs). The Noise situation of any location in the city , consisting of a Noise pollution indicator and a Noise composition, is derived through a context-aware tensor decomposition approach we proposed in [5]. Moreover, our demo highlights two components: a) ranking locations based on inferred Noise indicators in various settings, , on the weekdays (or weekends), in a time slot (or overall time), and in a Noise category (or all categories); b) revealing the distribution of noises over different Noise categories in a location.
2 Author Keywords Urban computing; urban noises; social media; big data ACM Classification Keywords Information interfaces and presentation ( , HCI): Miscellaneous. Introduction Noise pollution becomes a major problem in modern city during the rapid progress of global urbanization [6]. In addition to compromising working efficiency and the quality of sleep, noises may impair people s physical and mental health, therefore attracting a wide range of attention [2][3]. People living in major cities, especially in NYC, are increasingly concerned with Noise pollution, calling for technology that can diagnose the citywide Noise pollution and the composition of noises.
3 Paste the appropriate copyright/license statement here. ACM now supports three different publication options: ACM copyright: ACM holds the copyright on the work. This is the historical approach. License: The author(s) retain copyright, but ACM receives an exclusive publication license. Open Access: The author(s) wish to pay for the work to be open access. The additional fee must be paid to ACM. This text field is large enough to hold the appropriate release statement assuming it is single-spaced in Verdana 7 point font. Please do not change the size of this text box. *The paper was done when the first and third authors were interns in microsoft Research under the supervision of the second author.
4 Yilun Wang* microsoft Research No. 5 Danling Street, Beijing 100080, China Yu Zheng microsoft Research No. 5 Danling Street, Beijing 100080, China Tong Liu* microsoft Research No. 5 Danling Street, Beijing 100080, China However, inferring the Noise map of a city is difficult, due to lack of sensors, data sparsity, and people s subjective feelings etc., let along analyzing the Noise composition of a specific region in a time slot. To tackle these challenges, we use ubiquitous Noise related data sources ( , 311 data, check-in data in location-based social networks, POIs, and road networks) which are proved to have correlations with urban noises [5], and integrate these datasets into a context-aware tensor decomposition model.
5 The output of our model is a fine-grained Noise pollution indicator of any region in any time slot and any Noise category. By aggregating dimensions of the inferred tensor, we can diagnose citywide Noise situation in various settings. Based on the inference model we proposed and evaluated in [5], we implement a city -scale Noise map of New york city with Noise visualization and diagnosis. Moreover, two highlighted components of our system are proposed as follows: Location ranking based on inferred Noise indicators on the weekdays (or weekends), in a time slot (or overall time), and in a Noise category (or all categories). Noise composition analysis of main Noise categories and their distributions over time in a region.
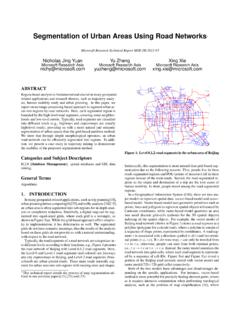
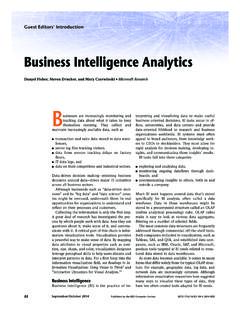
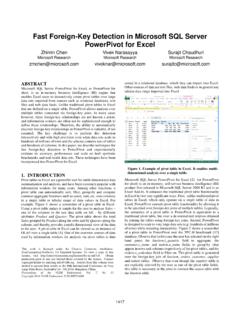
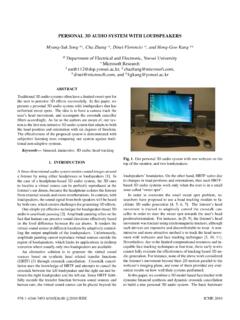
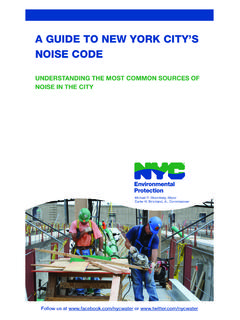
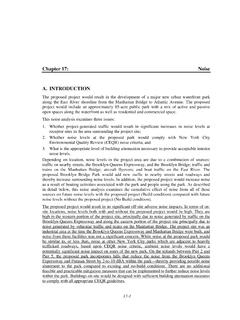
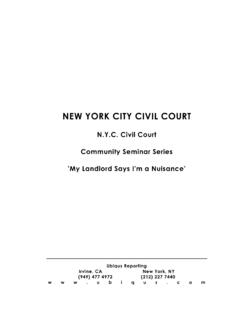
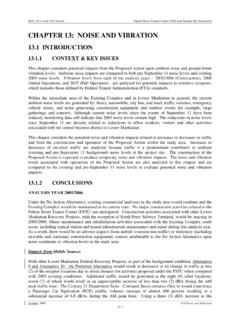
6 User Interface Design Our system is based on the tensor model described in our previous publication [5]. Here, we focus on the Noise map of NYC, and two highlighted components: location ranking and Noise composition analysis. As in Figure 2, the user interface of our system consists of two major parts: the left one in the red frame is the control panel and the right one in the green frame is the Noise map of NYC based on Bing Maps. The control panel has three components as in Figure 2. a) Data and Time Panel, which controls the map on right to visualize noises in various setting in terms of weekday (weekend), time of day, and category, , Figure 1(a) is the map at weekday 21:00 in Load Music/Party category.
7 By choosing Construction in the dropdown list, the map refreshes to Figure 1(b). Also, the slider in the time panel can be dragged to show the Noise situation in different time of day, while the buttons below are used to automatically play the city s Noise situation in chronological order; b) Top 5 noisiest location list; and c) Noise composition analysis. When selecting Overall Time checkbox, as in upper left of Figure 2, time panel aggregates the data in different time of day and transforms to pie chart of citywide Noise categories analysis in NYC. In the Noise map, we partition the city into disjointed regions using a map segmentation algorithm [4], assuming the Noise situation in a region is uniform while that of different regions may be different.
8 If having the 311 data, the Noise indicator of a region is denoted by the number of 311 complaints. The Noise map is overlaid on Bing Map which supports real-time scaling and moving. The darker a region s color is, the heavier Noise pollution in it. Besides, when the mouse hovers over a region, a corresponding infobox with detail region information appears, as in Figure 2(d). Location Ranking Based on Inferred Noise Indicators Noisiest region list is used to rank the top 5 noisiest regions in a specific setting, as in Figure 2(b). Please note that both the noisiest region list and the Noise map on right can reflect the location ranking based on inferred Noise indicators in our system.
9 (a) (b) (c) Figure 1. The Noise Map of NYC: (a) weekday Load Music / Party Noise at 21:00, (b) weekday Construction Noise at 21:00, and (c) weekend Construction Noise at 21:00 Figure 2. Screenshot of our Noise map system. Our system automatically names regions according to their titles and addresses of POIs and road networks inside. As shown in Figure 2(b), with Top 5 noisiest region list, we understand that Wall Street is the noisiest region of NYC at weekday 8:00 in all Noise categories with a Noise indicator of Noise Composition Analysis Noise composition analysis is used to dig in the Noise composition in a region and understand the main Noise categories and their distribution changing over time.
10 A click on the Noise map or noisiest region list can activate the analysis of that region. In Figure 2(c), an d) The infobox shows the detailed region information corresponding to the clicked region, including inferred Noise indicator, checkin-data, POIs in various categories, and road network. a) Data and Time Panel. Inferred Noise data on the weekdays (or weekends), in a time slot (or overall time), and in a Noise category (or all categories) can be selected by user and then visualized in the Noise map on the right. b) Location Ranking based on inferred Noise indicators. Top 5 noisiest regions and their inferred Noise indicators are shown.