Transcription of (A Simple Non-Mathematical Presentation)
1 Experimental modal analysis A Simple Non-Mathematical Presentation1 modal analysis and Controls LaboratoryPeter Avitabile Rev 052700 D R A F T D O C U M E N T for Sound&Vibration MgazineUniversity of Massachusetts LowellModal analysis and Controls LaboratoryUniversity of Massachusetts LowellM A C LEXPERIMENTAL modal analysis (A Simple Non-Mathematical Presentation) Peter AvitabileModal analysis and Controls LaboratoryMechanical Engineering DepartmentUniversity of Massachusetts LowellLowell, Massachusetts USAP refaceOften times, people ask some Simple questions regarding modalanalysis and how structures vibrate. Most times, it is impossibleto describe this simply and some of the basic underlying theoryneeds to be addressed in order to fully explain some of , many times the theory is just a little too much to handleand some of the concepts can be described without a rigorousmathematical treatment.
2 This document will attempt to explainsome concepts about how structures vibrate and the use of someof the tools to solve structural dynamic problems. The intent ofthis document is to simply identify how structures vibrate from anon- mathematical this being said. Let's start with the first question that isusually you explain modal analysis for me?In a nutshell, we could say that modal analysis is a processwhereby we describe a structure in terms of its naturalcharacteristics which are the frequency, damping and modeshapes - it's dynamic properties. Well that's a mouthful so let'sexplain what that means. Without getting too technical, I oftenexplain modal analysis in terms of the modes of vibration of asimple plate. This explanation is usually useful for engineerswho are new to vibrations and modal 1 - Simple Plate Excitation/Response ModelLet s consider a freely supported flat plate (Fig 1).
3 Let's applya constant force to one corner of the plate. We usually think ofa force in a static sense which would cause some staticdeformation in the plate. But here what I would like to do is toapply a force that varies in a sinusoidal fashion. Let's considera fixed frequency of oscillation of the constant force. We willchange the rate of oscillation of the frequency but the peakforce will always be the same value - only the rate ofoscillation of the force will change. We will also measure theresponse of the plate due to the excitation with anaccelerometer attached to one corner of the rate of oscillationFig 2 - Simple Plate ResponseNow if we measure the response on the plate we will noticethat the amplitude changes as we change the rate of oscillationof the input force (Fig 2).
4 There will be increases as well asdecreases in amplitude at different points as we sweep up intime. This seems very odd since we are applying a constantforce to the system yet the amplitude varies depending on theExperimental modal analysis A Simple Non-Mathematical Presentation2 modal analysis and Controls LaboratoryPeter Avitabile Rev 052700 D R A F T D O C U M E N T for Sound&Vibration MgazineUniversity of Massachusetts Lowellrate of oscillation of the input force. But this is exactly whathappens - the response amplifies as we apply a force with a rateof oscillation that gets closer and closer to the naturalfrequency (or resonant frequency) of the system and reaches amaximum when the rate of oscillation is at the resonantfrequency of the system. When you think about it, that's prettyamazing since I am applying the same peak force all the time -only the rate of oscillation is changing!
5 FrequencyFig 3 - Simple Plate Frequency Response FunctionThis time data provides very useful information. But if we takethe time data and transform it to the frequency domain usingthe Fast Fourier Transform then we can compute somethingcalled the frequency response function (Fig 3). Now there aresome very interesting items to note. We see that there arepeaks in this function which occur at the resonant frequenciesof the system. And we notice that these peaks occur atfrequencies where the time response was observed to havemaximum response corresponding to the rate of oscillation ofthe input 4 - Overlay of Time and Frequency Response FunctionNow if we overlay the time trace with the frequency trace whatwe will notice is that the frequency of oscillation at the time atwhich the time trace reaches it s maximum value correspondsto the frequency where peaks in the frequency responsefunction reach a maximum (Fig 4).
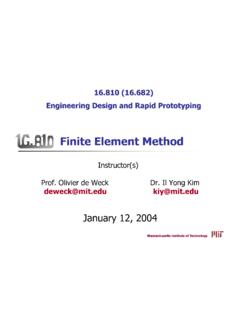
6 So you can see that we canuse either the time trace to determine the frequency at whichmaximum amplitude increases occur or the frequency responsefunction to determine where these natural frequencies the frequency response function is easier to most people are amazed at how the structure has thesenatural characteristics. Well, what s more amazing is that thedeformation patterns at these natural frequencies also take on avariety of different shapes depending on which frequency isused for the excitation let's see what happens to the deformation pattern on thestructure at each one of these natural frequencies. Let's place45 evenly distributed accelerometers on the plate and measurethe amplitude of the response of the plate with differentexcitation frequencies. If we were to dwell at each one of thefrequencies - each one of the natural frequencies - we wouldsee a deformation pattern that exists in the structure (Fig 5).
7 The figure shows the deformation patterns that will result whenthe excitation coincides with one of the natural frequencies ofthe system. We see that when we dwell at the first naturalfrequency, there is a first bending deformation pattern in theplate shown in blue (mode 1). When we dwell at the secondnatural frequency, there is a first twisting deformation patternin the plate shown in red (mode 2). When we dwell at the thirdand fourth natural frequencies, the second bending and secondtwisting deformation patterns are seen in green (mode 3) andmagenta (mode 4), respectively. These deformation patternsare referred to as the mode shapes of the structure. (That's notactually perfectly correct from a pure mathematical standpointbut for the Simple discussion here, these deformation patternsare very close to the mode shapes, from a practical standpoint.)
8 MODE 1 MODE 2 MODE3 MODE 4 Fig 5 - Simple Plate Sine Dwell ResponseNow these natural frequencies and mode shapes occur in allstructures that we design. Basically, there are characteristicsthat depend on the weight and stiffness of my structure whichdetermine where these natural frequencies and mode shapeswill exist. As a design engineer, I need to identify thesefrequencies and know how they might affect the response ofmy structure when a force excites the structure. Understandingthe mode shape and how the structure will vibrate when excitedExperimental modal analysis A Simple Non-Mathematical Presentation3 modal analysis and Controls LaboratoryPeter Avitabile Rev 052700 D R A F T D O C U M E N T for Sound&Vibration MgazineUniversity of Massachusetts Lowellhelps the design engineer to design better structures.
9 Nowthere is much more to it all but this is just a very simpleexplanation of modal , basically, modal analysis is the study of the naturalcharacteristics of structures. Understanding both the naturalfrequency and mode shape helps to design my structural systemfor noise and vibration applications. We use modal analysis tohelp design all types of structures including automotivestructures, aircraft structures, spacecraft, computers, tennisrackets, golf clubs, .. the list just goes on and we have introduced this measurement called a frequencyresponse function but exactly what is it?Just what are these measurements that are called FRFs? The frequency response function is very simply the ratio of theoutput response of a structure due to an applied force. We measureboth the applied force and the response of the structure due to theapplied force simultaneously.
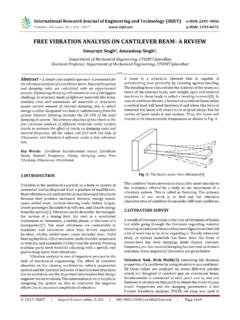
10 (The response can be measured asdisplacement, velocity or acceleration.) Now the measured timedata is transformed from the time domain to the frequency domainusing a Fast Fourier Transform algorithm found in any signalprocessing analyzer and computer software to this transformation, the functions end up being complexvalued numbers; the functions contain real and imaginarycomponents or magnitude and phase components to describethe function. So let s take a look at what some of the functionsmight look like and try to determine how modal data can beextracted from these measured 's first evaluate a Simple beam with only 3 measurementlocations (Fig 6). We see the beam below with 3 measurementlocations and 3 mode shapes. There are 3 possible placesforces can be applied and 3 possible places where the responsecan be measured.