Transcription of A Study of Peripheral Smears in Neonates - IOSR Journals
1 IOSR Journal of Dental and Medical Sciences (IOSR-JDMS) e-ISSN: 2279-0853, p-ISSN: 14, Issue 2 Ver. III (Feb. 2015), PP 55-64 DOI: 55 | Page A Study of Peripheral Smears in Neonates Dr. Dhanamjayaraoteeda MD (Pathology) Dcp1 Dr. Rajendra Prasad Jalagam MD (Pathology)2 1,2, Associate Professor, Dept of Pathology, Siddhartha medical college, Abstract: The hematological parameters in a newborn are distinctly different from the normal adult values. NRBCs are immature RBCs normally seen in the Peripheral blood of neonatesupto 5th day of life. At birth 3 to 10 NRBCs per 100 WBCs are present. Premature birth and foetal hypoxia can cause the number to increase. NRBC count in umbilical venous blood of Neonates has been reported as a possible marker of perinatal asphyxia.
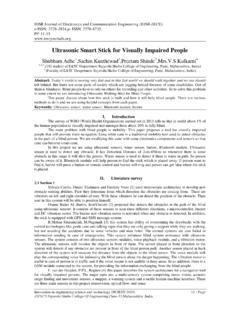
2 Leukocytosis refers to an increase in the total number of WBCs due to any cause. Thrombocytopenia can be a marker of an underlying disease as well as an obvious risk factor for hemorrhage. Keywords: Neonates , NRBC s, Peripheral smear , Thrombocytopenia I. Introduction A Peripheral blood smear is a glass microscope slide coated on one side with a thin layer of venous blood. The slide is stained with Leishmans, and examined under a microscope. Microscopic examination of the Peripheral blood is used to supplement the information provided by automated cell counter. However precise classification of abnormal cells requires a trained hematologist, a well-made Peripheral blood smear , and a light microscope with good optical characteristics. Peripheral blood smear examination provides information that cannot be obtained from automated cell counting.
3 Hematologic values in Neonates differ significantly from those in older children and adults. Quantitative and qualitative differences are present as a reflection of the developmental changes during fetal hematopoiesis and, so, correlate with gestational age. At birth, the hemoglobin, mean corpuscular volume, and WBC counts of term newborns are significantly higher than those of older children and adults, and in preterm Neonates the differences are even more pronounced. This review explores these differences and the major factors that account for them from the hematology laboratory standpoint. Early diagnosis of neonatal septicemia is a vexing problem because of its nonspecific clinical picture. Bacterial infection in the newborn still account for a considerable morbidity and mortality. This is because the newborn especially the premature are prone to serious infections by organisms and partly because the signs of these infections may be absent or minimal and hard to detect.
4 Thus fatal septicemia may occur with little warning. Hence the timely diagnosis of sepsis in Neonates is critical as the illness can be rapidly progressive and in some instances fatal. II. Objectives 1. To Study the variations in RBC,WBC, and platelets in Peripheral smear of Neonates . 2. To correlate with the clinical findings III. Methodology Source of Data: Peripheral smear slides of all term Neonates born in GGH, cases will be included in the Study . Method of collection of data: This is a prospective Study done from January 2012 to September of venous blood will be collected from newborns in EDTA smear will be studied according to standard operating procedure with special emphasis on RBC,WBC and platelet containing the details of the patient and informed consent from the parents of the patient for the present Study is maintained.
5 Inclusion criteria: All term Neonates Exclusion criteria: 1. Preterm Neonates 2. Those born with any congenital anomalies Preparation of slides: Blood for examination is obtained by venepuncture and collected in EDTA vacutainers. Ethylene di amine tetra acetic acid (EDTA) is the anticoagulant preferred. A Study of Peripheral Smears in Neonates DOI: 56 | Page Staining of Thin Blood Films: For the current Study Leishmans stain has been made use of due to easy feasibility. Preparation- Dissolve of powered Leishmans dye in 100ml of acetone-free methyl alcohol in a conical it to 50 C for half an hour with occasional it and filter it. Procedure: Pour Leishmans stain drop wise on the slide and wait for 2 minutes. This allows fixation of blood film in methyl alcohol.
6 Add double the quantity of buffered water over the slide. Mix by rocking for 8 min. Wash in water for 1 to 2 minutes. Dry in air and examine under oil immersion lens of the microscope. Statistical analysis: A qualitative analysis of the data was done using Pearsons Chi square test, and Fischers Exact test. IV. Results Age Of The Study Group: The age of the patients in our Study group ranged from Day 1 of life to Day of newborns were <3 days of newborns were between 4 to 10 days old and 16% of newborns were between 11 to 28 days old as shown in the table and chart below. Table 3 .Age distribution Age(days) Counts Percentages Less than 3 230 4 to 10 54 18% 11 to 28 16 16% Figure 8. Doughnut chart showing age distribution. The mean age of the Study group was day 1 of life as shown in the table below.
7 Table 4 .Mean age of Study group N Minimum Maximum Mean SD 300 1 3 .559 Sex Distribution: The bulk of the newborns in this Study were females. Below is the table and chart showing the data. Table 5. Sex distribution Sex Counts Percentage Male 97 Female 203 Figure 9. Doughnut chart showing sex distribution. A Study of Peripheral Smears in Neonates DOI: 57 | Page Age And Sex Correlation Among the 230 newborns who were less than <3 days old,166 were females and 64 were males and those between 4 to 10 days old,31 were males and 23 were females. Out of the 16 newborns between 11 to 28 days,6 were females and 10 were males. The age and sex cross tabulation encountered in our Study was as follows. Table 6. Age and sex correlation SEX Male Female Total AGE(Days) Less than 3 Count 64 166 230 % of total 4 to 10 Count 23 31 54 % of total 11 to 28 Count 10 6 16 % of total TOTAL Count 97 203 300 % of total Figure 10.
8 Bar graph representing age and sex cross tabulation. Rbc Morphology: A thorough Peripheral smear examination was done and morphology of RBCs were studied. Of the 300 newborns, 283 of them had normocytic normochromic RBCs and 17 of them had RBCs which were microcytic and hypochromic. The data has been given in the table and chart below. Table 7. RBC morphology Count Percentage NN 283 MH 17 *NN-Normocytic Normochromic, MH- Microcytic hypochromic. Figure 11. RBC morphology. Mean Hb Value Of the total 300 cases, Hb levels varied between 6g/dl to 22g/dl. The mean value of Hb in our Study is given in the table below. Table 8. Mean Hb value Total(N) Minimum Maximum Mean Std deviation 300 6 22 A Study of Peripheral Smears in Neonates DOI: 58 | Page Total Count (Tc): Out of 300 cases,273 cases had a total count <25000 and 27 cases had total count > obtained is given in the table and chart below.
9 Table 9. Total count (WBCs) TC Frequency Percentage Less than 25000 273 91% More than 25000 27 9% Figure 12. Pie chart showing total count. Estimation Of Total Count In Neonates To Diagnose Sepsis By Hss The HSS scores obtained in our Study were 0,1,4 and cases in our Study had an HSS score 0 of which 253 cases had a TC <25000 and 4 cases had a TC >25000 16 cases had an HSS score of of them had TC <25000 24 cases had an HSS score of 4,of which 21 cases had a TC >25000 and 3 cases had a TC < 25000 3 cases had as HSS score of 5, of which 2 cases had TC >25000 and 1 case had a TC < 25000 Table 10. TC and HSS correlation TC HSS TOTAL 0 1 4 5 <25000 count 234 35 3 1 273 % 78% 3% >25000 count 4 0 21 2 27 % 0% 7% Total count 238 35 24 3 300 % Figure 13. Bar diagram showing TC and HSS correlation. The mean value of NRBCs is shown in table below.
10 Table 11. Mean NRBC value N Minimum Maximum Mean Std Deviation 300 5 18 A Study of Peripheral Smears in Neonates DOI: 59 | Page In a normal neonate, NRBCs are rapidly cleared from the blood stream after birth. In healthy term Neonates , virtually no NRBC will be found after third or fourth day of life, although they may be present in small number upto 1 week in preterm babies. In our Study we got a mean value of NRBCs per 100 WBCs. The mean value of band forms of neutrophils is as follows. Table 12 .Mean value of band forms of neutrophils N Minimum Maximum Mean Std Deviation 300 0 25 Elevation of band forms of neutrophils is not specific for infection, but may be secondary to inflammatory processes, tissue damage or necrosis, neoplasia, intoxication, metabolic abnormalities, haemorrhage, hemolysis or drugs.