Transcription of A (very basic) Introduction to GIS using ArcGIS
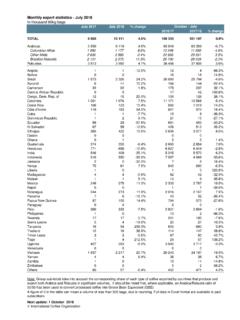
1 An Introduction to GIS using ArcGIS . Spring Lab Workshop 5 March 2013. PhD Candidate Department of Politics New York University Agenda What is GIS? Basic GIS Concepts Introduction to ArcGIS . Coordinates & Projections GIS Analysis Thematic maps exporting GIS data /analysis to a dataset Back and forth between GIS concepts and ArcGIS . data Login to the lab computer Navigate to the I: drive Copy the folder titled ArcGIS_Workshop_sp13 to your Desktop Please do not use the files in the I: drive What is GIS? Geographic Information System Goal: Display geographic information on a map Example: Population of continental United States (between the ages 30-34).
2 Information - Features Real world objects on a map Airports Railroads Counties Information - Attributes Describe the features in a GIS. County name County size County vote share System Database that links features & attributes Draw (pretty!) maps Edit & analyze geographic data GIS Functions Visualization Display maps (paper & computer). Color or grey-scale Database Import geographic data Convert data to information Analyze Find areas of the map based on different criterion GIS Concepts Features Layers Scales Features . Information Point Shape to describe Shape features Color Location Name Line Outline Latitude Capital Symbol Pattern Longitude Population Attribute Polygon All of the above Layers Collection of features Features have Same shape Same attributes Example US Population Airports View different layers in a single map Scale Size of feature vs Size in the real world 1 : 12,000.
3 1 inch : 5 miles Zoom in/out to see more/less information data Storage Types Vector Raster Vector data Shapes & Coordinates Points One pair of coordinates ( , cities, airports). Lines Two or more coordinates ( rivers, roads). Polygons Three or more coordinates & closed ( states). Raster data Continuous data Cells to store data Cells have same size Measurement like quantity Code for category Every raster has an origin All cells have a unique position wrt to this origin GeoDatabase GIS data stored in a database Collection of geographic data sets, real-world object definitions, and relationships . Feature class digital collection of features with the same shape &.
4 Attributes Layers are the visual representation of a feature class Table to store feature geometry Row feature Column attribute Can be used to store both vector and raster data Illustration ArcGIS Introduction ArcGIS Desktop ArcMap - Integrated map display, editing, and production environment. ArcMap is used to display, query, edit, create, and analyze your geographically referenced data . ArcCatalog - data management application. ArcCatalog helps users to browse, search, explore, view, and manage data (with metadata creation and editing capabilities) and maps. It also helps GIS. database administrators maintain spatial and tabular GIS data for use by others in their organization.
5 ArcDesktop ArcToolbox: Geoprocessing tool. ArcToolbox helps users to perform geoprocessing operations such as data conversion, overlay processing, buffering, proximity analysis and map transformation. Each tool has a menu-driven interface with wizards or dialogs. Search: Allows to find data , maps and tools by keywords or data types. In ArcMap Create Folder Connections Click on Add data Create a Folder Connection to H:\ArcGIS_Workshop_sp13 . The maps are stored as shapefiles simple, nontopological format for storing the geometric location and attribute information of geographic features . Used for points, lines, or polygons In ArcMap Adding data to a Map Click on the Add data button Navigate to where you stored the files Choose Click on the Add data button again Choose Navigating and finding Information Zoom in/out Identify some states and airports.
6 Find the location of the John F. Kennedy airport Open the Attribute table and look at the different attributes Coordinates & Projections Coordinates Shape of the Earth: Ellipsoid A three-dimensional, closed geometric shape, all planar sections of which are ellipses or circles.. Approximated by a Spheroid A three-dimensional shape obtained by rotating an ellipse about its (major or minor) axis . Sphere: used for mathematical calculations such that it has the same surface area as a spheroid (authalic sphere). Latitude/Longitude Parallels & Medians Based on 360 degrees where 1 degree = 60 minutes 1 minute = 60 seconds Latitude locate features from North to South Zero is at the Equator Northern hemisphere 0 to 90N.
7 Southern hemisphere 0 to 90S. Longitude locate features East to West Zero at the Prime Meridian (in Greenwich, GB). Eastern hemisphere 0 to 180E. Western hemisphere 0 to 180W. Decimal Degrees Another way to denote coordinates Latitude for Broadway & 42nd Street: 40 45' 21 . 45 minutes = .75 degrees (45/60). 21 seconds = .00583 degrees (21/3600). Add up the degrees: 40 + .75 + .00583 = DD. Note: Southern and Western hemispheres have negative values Projections Process of converting points on a globe to a flat map surface Distortion always occurs Shape Area Direction Distance Which projection to use? Which spatial property (shape, area, direction, distance) of objects on the globe do you want to preserve in the flat map?
8 Examples Mercator preserves shape Sinusoidal preserves area Equal-area Cylindrical preserves area, but shapes are distorted Azimuthal Equidistant preserves distance and direction, but shapes/sizes distorted at outside edges Robinson middle ground More on Projections Types of Projections Planar (useful for polar maps). Cylindrical (useful for equatorial maps). Conic Light Source Gnomonic center of the Earth Stereoscopic viewed from one pole to another Orthoscopic viewed from space Aspect Orientation of the globe to the projection surface World Geodatic System 1984. The most widely used geocentric datum and geographic coordinate system today (designed by the Department of Defense).
9 Used by GPS. Typically referred to as WGS84. Starting point for the calculation of shape is the Earth s center Projections based on this have uniform accuracy across the globe Very useful for world maps Universal Transverse Mercator A projected coordinate system that divides the world between 80 S and 84 N latitude into 60 zones, each 6 of longitude in width Zone 1 covers longitude 180 to 174 W. Numbering increases as we move East Zone 60 that covers longitude 174 to 180 East Very useful for finer scale mapping 10 minute break! Basic GIS Analysis Buffer Tool Select by Location Calculation of Area (if time permits).
10 Calculation of Perimeter (if time permits). Buffer Tool Right click on the data Frame Choose data Frame Properties Navigate to the General Tab Select Map and Display Units as Miles . Click on Add data Choose Click on the Add data button again Choose Click on the Add data button again Choose Click on the Geoprocessing Menu Choose the Buffer Tool Buffer Tool (contd). Choose the Input feature as the JFK Layer Leave the Output as the Default Let the Distance be a Linear Unit with a radius of 100 miles Click Ok Zoom to new Buffered layer Right-click on the US Airports layer Choose Properties Navigate to the Labels tab Select Label features in this layer with AIRPT_NAME.