Transcription of A (very) short introduction to R
1 A (very) shortintroduction to RPaul Torfs & Claudia BrauerHydrology and Quantitative Water Management GroupWageningen University, The Netherlands3 March 20141 IntroductionR is a powerful language and environment for sta-tistical computing and graphics. It is a public do-main (a so called GNU ) project which is similarto the commercial S language and environmentwhich was developed at Bell Laboratories (for-merly AT&T, now Lucent Technologies) by JohnChambers and colleagues. R can be considered asa different implementation of S, and is much usedin as an educational language and research main advantages of R are the fact that Ris freeware and that there is a lot of help availableonline. It is quite similar to other programmingpackages such as MatLab (not freeware), but moreuser-friendly than programming languages such asC++ or Fortran. You can use R as it is, but foreducational purposes we prefer to use R in combi-nation with the RStudio interface (also freeware),which has an organized layout and several document contains explanations, exam-ples and exercises, which can also be understood(hopefully) by people without any programmingexperience.
2 Going through all text and exercisestakes about 1 or 2 hours. Examples of frequentlyused commands and error messages are listed onthe last two pages of this document and can beused as a reference while Getting Install RTo install R on your computer (legally for free!),go to the home website of R : On the R-website you can also find this docu-ment: + do the following (assuming you work on awindows computer): clickdownload CRANin the left bar choose a download site chooseWindowsas target operation system clickbase chooseDownload R for Windows andchoose default answers for all questionsIt is also possible to run R and RStudio froma USB stick instead of installing be useful when you don t have administra-tor rights on your computer. See our separate note How to use portable versions of R and RStudio for help on this Install RStudioAfter finishing this setup, you should see an R icon on you desktop.
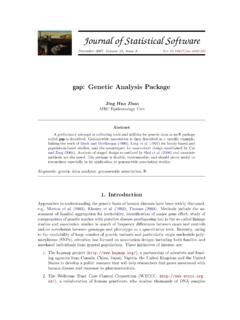
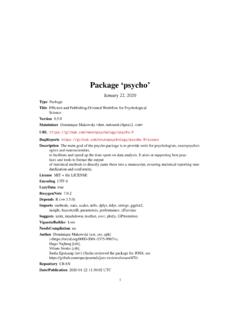
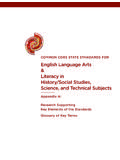
3 Clicking on this would startup the standard interface. We recommend, how-ever, to use the RStudio interface. To installRStudio, go to: do the following (assuming you work on a win-dows computer): clickDownload RStudio clickDownload RStudio Desktop clickRecommended For Your System download and run it (choose defaultanswers for all questions) RStudio layoutThe RStudio interface consists of several windows(see Figure 1). Bottom left:console window(also calledcommand window). Here you can typesimple commands after the > prompt andR will then execute your command. This isthe most important window, because this iswhere R actually does stuff. Top left:editor window(also calledscriptwindow). Collections of commands (scripts)can be edited and saved. When you don t get At the moment of writing was the latest the most recent one. There are many other (freeware) interfaces, such as 1 The editor, workspace, console and plots windows in window, you can open it withFile New R scriptJust typing a command in the editor windowis not enough, it has to get into the commandwindow before R executes the command.
4 Ifyou want to run a line from the script window(or the whole script), you can clickRunorpressCTRL+ENTERto send it to the commandwindow. Top right:workspace / history the workspace window you can see whichdata and values R has in its memory. Youcan view and edit the values by clicking onthem. The history window shows what hasbeen typed before. Bottom right:files / plots / packages /help window. Here you can open files, viewplots (also previous plots), install and loadpackages or use the help can change the size of the windows by drag-ging the grey bars between the Working directoryYourworking directoryis the folder on your com-puter in which you are currently working. Whenyou ask R to open a certain file, it will look in theworking directory for this file, and when you tellR to save a data file or figure, it will save it in theworking you start working, please set your work-ing directory to where all your data and script filesare or should be :setwd("directoryname").
5 For example:> setwd("M:/Hydrology/R/")Make sure that the slashes are forward slashes andthat you don t forget the apostrophes (for the rea-son of the apostrophes, see section ). R is casesensitive, so make sure you write capitals RStudio you can also go toTools / Setworking LibrariesR can do many statistical and data analyses. Theyare organized in the standard installation, most commonpackages are get a list of all installed packages, go to thepackages window or typelibrary()in the console2window. If the box in front of the package name isticked, the package is loaded (activated) and canbe are many more packages available on theR website. If you want to install and use a pack-age (for example, the package called geometry )you should: Install the package: clickinstall packagesin the packages window and typegeometryor ("geometry")in thecommand window. Load the package:check box in front ofgeometryor typelibrary("geometry")in thecommand Some first examples of CalculatorR can be used as a calculator.
6 You can just typeyour equation in the command window after the > :> 10^2 + 36and R will give the answer[1] 136 ToDoCompute the difference between 2014 and theyear you started at this university and dividethis by the difference between 2014 and the yearyou were born. Multiply this with 100 to getthe percentage of your life you have spent atthis university. Use brackets if you need you use brackets and forget to add the closingbracket, the > on the command line changesinto a + . The + can also mean that R is stillbusy with some heavy computation. If you wantR to quit what it was doing and give back the > ,pressESC(see the reference list on the last page). WorkspaceYou can also give numbers a name. By doing so,they become so-called variables which can be usedlater. For example, you can type in the commandwindow:> a = 4 You can see thataappears in the workspace win-dow, which means that R now remembers whatais.
7 You can also ask R whatais (just typeaENTERin the command window):> a[1] 4or do calculations witha:> a * 5[1] 20If you specifyaagain, it will forget what valueit had before. You can also assign a new value toausing the old one.> a = a + 10> a[1] 14To remove all variables from R s memory, type> rm(list=ls())or click clear all in the workspace window. Youcan see that RStudio then empties the workspacewindow. If you only want to remove the variablea, you can typerm(a).ToDoRepeat the previous ToDo, but with severalsteps in between. You can give the variablesany name you want, but the name has to startwith a Scalars, vectors and matricesLike in many other programs, R organizes num-bers inscalars(a single number 0-dimensional),vectors(a row of numbers, also called arrays 1-dimensional) andmatrices(like a table 2-dimensional).Theayou defined before was a scalar. To definea vector with the numbers 3, 4 and 5, you need thefunction c, which is short for concatenate (pastetogether).
8 B=c(3,4,5)Matrices and other 2-dimensional structureswill be introduced in Section 6. Some people prefer te use<-instead of=(they do thesame thing).<-consists of two characters,<and-, andrepresents an arrow pointing at the object receiving thevalue of the expression. See next Section for the explanation of FunctionsIf you would like to compute the mean of all theelements in the vectorbfrom the example above,you could type> (3+4+5)/3 But when the vector is very long, this is very bor-ing and time-consuming work. This is why thingsyou do often are automated in functions are standard in R or in one of thepackages. You can also program your own func-tions (Section ). When you use a function tocompute a mean, you ll type:> mean(x=b)Within the brackets you specify give extra information to the this case, the argumentxsays of which setof numbers (vector) the mean should computed(namely ofb). Sometimes, the name of the argu-ment is not necessary:mean(b)works as the sum of 4, 5, 8 and 11 by first com-bining them into a vector and then using functionrnorm, as another example, is astandard R function which creates random sam-ples from a normal distribution.
9 Hit theENTERkey and you will see 10 random numbers as:1> rnorm(10)2[1] [5] [9] Line 1 contains the command:rnormis the func-tion and the 10 is an argument specifying howmany random numbers you want in this case10 numbers (typingn=10instead of just10wouldalso work). Lines 2-4 contain the results: 10 random num-bers organised in a vector with length the same command again produces 10new random numbers. Instead of typing the sametext again, you can also press the upward arrowkey ( ) to access previous commands. If you want10 random numbers out of normal distributionwith mean and standard deviation you cantype> rnorm(10, mean= , sd= )showing that the same function (rnorm) may havedifferent interfaces and that R has so callednamedarguments(in this casemeanandsd). By the way,the spaces around the , and = do not this example to the previous onealso shows that for the functionrnormonly thefirst argument (the number 10) is compulsory, andthat R gives default values to the other so-calledoptional arguments .
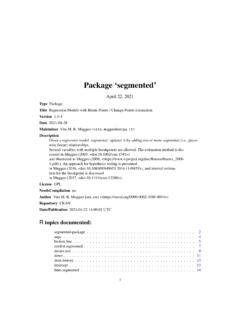
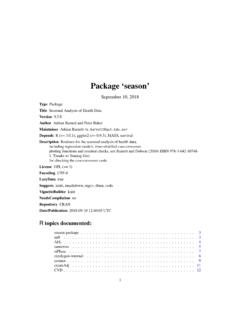
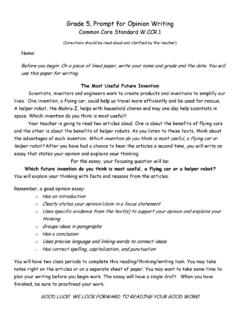
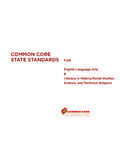
10 RStudio has a nice feature: when you typernorm(in the command window and pressTAB,RStudio will show the possible arguments (Fig. 2). PlotsR can make graphs. The following is a very sim-ple example:1> x = rnorm(100)2> plot(x) In the first line, 100 random numbers areassigned to the variablex, which becomes avector by this operation. In the second line, all these values are plottedin the plots 100 normal random Help and documentationThere is a large amount of (free) documentationand help available. Some help is automaticallyinstalled. Typing in the console window the com-mand> help(rnorm)gives help on thernormfunction. It gives a de-scription of the function, possible arguments andthe values that are used as default for optionalarguments. Typing> example(rnorm) Use the help function (Sect. 4) to see which values areused as default. See Section 7 for slightly less trivial 2 RStudio shows possible arguments when you pressTABafter the function name and some examples of how the function can HTML-based global help can be called with:> ()or by going to the help following links can also be very useful: full manual.)