Transcription of AASHTO Flexible Pavement Design Method - Seismic …
1 AASHTO Flexible Pavement Design Method Design considerations for the AASHTO Flexible Pavement Design Pavement performance Traffic Roadbed soils (subgrade material) Materials of construction Environment Drainage Reliability The following factors are considered in the Pavement thickness Design . Pavement performance Structural Cracking, faulting, raveling, etc. Functional Riding comfort (measured in terms of roughness of Pavement .) Serviceability Performance: Measured by PSI Present Serviceability Index with scale 0 to 5. 0 Road closed 5 Just constructed Initial PSI (pi) Terminal PSI (pt) to for major highways for lower class highways for very special cases PSI Pavement Condition From the AASHO Road Test (1956 1961) Typical PSI vs.
2 Time Time Serviceability (PSI) p0 pt p0 - pt Terminal Serviceability Level Traffic In the AASHTO Flexible Pavement Design , traffic is considered in terms of ESAL for the terminal PSI (Table for pt = ) We must assume the structural number of the Pavement . So, we must check if the final SN3 is similar to the assumed SN. Higher SN means stronger Pavement , thus the impact of traffic on Pavement deteriorations is less. Roadbed soils (Subgrade material) CBR (California Bearing Ratio), R-value (Resistance), and Mr (Resilient modulus) are used to describe the property of the subgrade material. During the structural Design , only Mr values are used. The following conversion formulas are used if either CBR or R-values are given.
3 Mr (lb/in2) = 1500 x CBR for fine-grained soils with soaked CBR of 10 or less. Mr (lb/in2) = 1000 + 555 x (R-value) for R <= 20 Materials of construction (Subbase), a3 Charts are available to convert the properties of Pavement construction materials to structural coefficients: a3, a2, and a1 Structural coefficient of the subbase, a3 Use CBR, R-value, or Mr to find a3 values Materials of construction (Base course), a2 Structural coefficient of the base course, a2 Use CBR, R-value, or Mr to find a2 values Materials of construction (AC surface), a1 = Resilient modulus, Mr Structural coefficient of the AC surface, a1 Environment Temperature and rainfall affect the level of strength of the subgrade, reflected on the value of resilient modulus.
4 AASHTO developed a chart that helps us to estimate the effective roadbed soil resilient modulus using the serviceability criteria (in terms of relative damage, uf. ) Determine the average uf. value and obtain Mr from the chart or the equation of uf.. The bar on the right is used twice: Once to read uf value for each month s sample Mr, then to read annual average Mr using the average uf value. Step 1 Step 3 Step 2 Drainage The effect of drainage on the performance of Flexible pavements is considered with respect to the effect of water on the strength of the base material and roadbed soil. This effect is expressed by the drainage coefficient, mi. This value is dependent on the drainage quality and the percent of time , the time to which a Pavement structure is exposed to moisture levels approaching saturation.
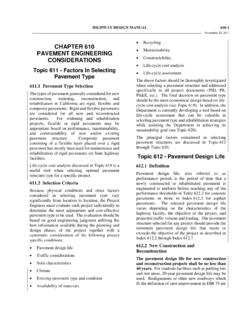
5 Definition of drainage quality and finding recommended mi values Time required to drain the base/subbase layer to 50% saturation. If Fair and 30% exposure, then mi is Step 1 Step 2 Reliability The reliability factor (FR) is computed using: The Reliability Design level (R%), which determines assurance levels that the Pavement section designed using the procedure will survive for its Design period (it is a z-score from the standard normal distribution) The standard deviation (So) that accounts for the chance variation in the traffic forecast and the chance variation in actual Pavement performance for a given Design period traffic, W18. oRRSZF 10logSD, So Flexible pavements Rigid pavements Functional Classification Recommended Level of Reliability Urban Rural Interstate and other freeways Principal arterial 80-99 75-95 Collectors 80-95 75-95 Local 50-80 50-80 Structural Design The object of the Design using the AASHTO Method is to determine a Flexible Pavement SN adequate to carry the projected Design ESAL.
6 The Method discussed in the text applies to ESALs greater than 50,000 for the performance period. The Design for ESALs less than this is usually considered under low-volume roads. )1/( ) ( roRMSNPSISNSZWS implify this as f(W18) = f(ZRSo) + f(SN) 33322211mDamDaDaSN Where How to use Fig. to get structural numbers based on Eq. For subgrade, Mr= 9000 lb/in2 SN3= For sub-base, Mr=13500 lb/in2 For base course, Mr=31000 lb/in2 SN2= SN1= Once SN value is set, thickness Design 33322211mDamDaDaSN 111 DaSN 222112mDaDaSN 333222113mDamDaDaSN Proceed in this direction Use for a3, for a2, for a1, and Tab. and m2 and m3. Find the depth that results in a SN value close to the SN value obtained from Fig.
7 A b Equivalent Axle Load Factors, Single axles Equivalent Axle Load Factors, tandem axles Equivalent Axle Load Factors, triple axles