Transcription of Absolute and Relative Gas Concentration: Understanding ...
1 1 Absolute and Relative Gas Concentration: Understanding oxygen in Air Bruce Bugbee and Mark Blonquist The amount of oxygen (O2) in air is described in two ways and it is essential to be able to convert between them. The conversion comes from the ideal gas law, PV = nRT (P is pressure, V is volume, n is Absolute gas concentration, T is temperature, and R is the ideal gas constant), which most people were first exposed to in Chemistry 101. The simplest and most common way to report the amount of O2 in air is to express it Relative to the other compounds in the air as a fraction or percentage. The atmospheric concentration of O2 has remained constant for several hundred years at This means that exactly of the molecules in the atmosphere are O2 molecules. The percentage is the same on the beach in Florida and in the mountains of Logan, Utah. However, the Absolute O2 concentration, or the amount of O2 molecules per unit volume, does not remain constant.
2 An O2 tank is required to climb Mount Everest, even though the Relative O2 concentration is still The Absolute O2 concentration determines the rate of most biological and chemical processes, but the Relative O2 concentration is typically reported. This is similar to discussing Relative humidity when Absolute humidity is what determines evaporation rates. Absolute and Relative measurements are expressed using several different units. The following table shows the units used to describe both measurements. Absolute amount of gas Relative amount of gas moles of O2 per unit volume ( moles per Liter) % O2 in air ( in ambient air) mass of O2 per unit volume ( grams per Liter) (O2 has a mass of 32 g per mole) partial pressure ( kilopascals (kPa)) mole fraction ( moles of O2 per mole of air) ( mol O2 per mole of ambient air) (this can also be expressed as kPa O2 per kPa Air) The Absolute O2 concentration changes a few percent from day to day with changes in barometric pressure and temperature.
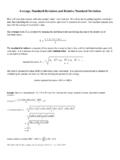
3 As barometric pressure decreases, or as temperature increases, air expands and the number of O2 molecules per unit volume decreases. The opposite occurs as barometric pressure increases or as temperature decreases. Like most gas sensors, the Apogee O2 sensor responds to the Absolute concentration of O2 in air. Thus changes in pressure and temperature change the output of the sensor even though the Relative concentration of O2 has not changed. Fortunately, the sensor responses to pressure and temperature (P and T) are repeatable, thus it is possible to measure P and T and correct for them in software. Effect of Barometric Pressure on the Output of the Apogee oxygen Sensor The ideal gas law shows that Absolute gas concentration increases by (1 kPa / kPa) at sea level for every 1 kPa increase in pressure. Because air contains O2, a 1 kPa pressure increase results in an increase of O2 per kPa ( * ) increase in barometric pressure at sea level.
4 Due to lower barometric pressure at higher elevations, the 2percentage increase in Absolute gas concentration per kPa increases with elevation. For example, the Absolute gas concentration increases by at 1400 m elevation for every 1 kPa increase in pressure. This results in an increase of O2 per kPa ( * ) increase in barometric pressure. For the most precise measurements, this correction should be applied to all O2 sensors. For example, the average barometric pressure in Logan, Utah, is 86 kPa (1400 m elevation). If an O2 sensor were calibrated to read O2 at 86 kPa then the sensor would read O2 at 87 kPa [ + *(87-86)] and O2 at 85 kPa [ + *(85-86)]. The equation to correct O2 measurements for barometric pressure at any elevation is: % O2 = measured % O2 [(100 / P) * ] % O2 / kPa * (measured kPa calibrated kPa), where P is the barometric pressure [kPa] at the given elevation and is calculated from: P = kPa kPa * {1 [1 (E / )] }, where E is elevation in meters.
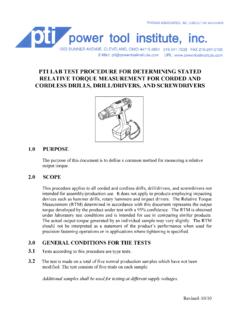
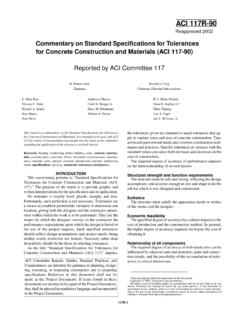
5 The correction factor in the first equation, [(100 / P) * ] % O2 / kPa, is tabulated below for several elevations and the corresponding barometric pressures, calculated from the second equation. A figure showing the barometric pressure decrease with increasing elevation (calculated from the second equation) is also shown, along with a second order polynomial fit to the data. Elevation [m] Pressure [kPa] Correction Factor [% O2 / kPa] 0 500 1000 1500 2000 3 Example of Pressure Correction The Figure below shows the uncorrected O2 concentration in soil, the barometric pressure, and the O2 concentration with the pressure correction applied.
6 The data show the improvement in the measurement as a result of the pressure correction. The pressure-corrected O2 measurements no longer slope up with increasing pressure and slope down with decreasing pressure. However, there is still a diurnal oscillation due to temperature, which is discussed in the next section. Pressure can be simultaneously measured with O2 measurements to correct for the pressure effect. Many electronic pressure sensors are available. If the pressure sensor is indoors, we have found that the Omega model EWS-BP-A Pressure Transmitter ( ) is accurate and inexpensive ($145). For comparisons among barometric pressure sensors see Electronic Measurement of Barometric Pressure: A Comparison of Omega Model EWS-BP-A, Setra Model 276, Setra Model 278, and Vaisala Model PTB101B published online by the Utah State University Crop Physiology Laboratory ( ).
7 Wiring instructions for the Omega EWS-BP-A are shown below. 4 Effect of Temperature and Humidity on the Output of the Apogee oxygen Sensor Sensor in Air Effect of temperature The ideal gas law shows that gas concentration decreases by (1 K / 293 K) for every 1 C increase in temperature. Because air contains O2, a 1 C temperature increase results in a decrease of O2 per C ( * ) increase in temperature. However, there is also an effect of temperature on the electronics in the sensor, which causes the output to increase by approximately O2 per C temperature increase. Because this is an effect on the sensor electronics, it varies slightly from sensor to sensor. The net effect of the ideal gas law ( ) and the sensor electronics (+ ) is an increase in the output of the sensor by per C increase in temperature in dry air. For example, if an O2 sensor were calibrated to read O2 at 25 C then the sensor would read O2 at 30 C [ + *(30-25)] and O2 at 20 C [ + *(20-25)].
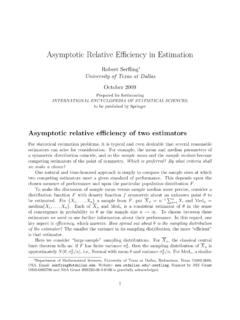
8 The equation to correct O2 measurements in air for temperature is: % O2 = measured % O2 % O2 / C * (measured C calibrated C) Effect of humidity As the humidity in air increases, water vapor molecules displace O2 molecules causing the output of the sensor to decrease. The effect of humidity is larger at warmer temperatures because there is more water vapor in the air. The figure below shows the humidity effect on Relative O2 concentration at three different temperatures. The correction factors for each temperature, 15, 25, and 35 C, are , , and % O2 per 1 % increase in Relative humidity, respectively. 5 Sensor in Soil The humidity correction is more important when the sensor is used to measure O2 in soil gas, because the air is always at 100% Relative humidity. Between 20 and 25 oC the water vapor displacement causes the output of the sensor to decrease by per oC increase in temperature.
9 This exact effect can be calculated from psychometric equations and is slightly larger at higher temperatures and slightly smaller at cooler temperatures. The correction for the effect of temperature on the solubility of CO2 in water should be made for measurement of O2 in soil. The solubility of CO2 in water decreases with increasing temperature, and the resulting increase in CO2 in the soil gas causes O2 molecules to be displaced. If the CO2 concentration in the soil gas is 1%, this effect decreases the output by per oC increase in temperature. The solubility of O2 is also temperature dependent, but O2 solubility in water is 30 times less than CO2 solubility in water, thus the O2 solubility effect can be ignored. The water vapor dilution effect and the CO2 solubility effect both decrease the sensor output. Their combined effects cause the output of the O2 sensor to decrease per oC increase in temperature.
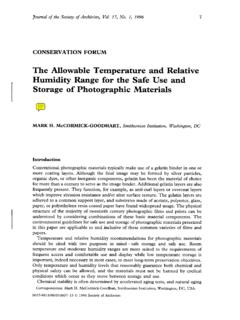
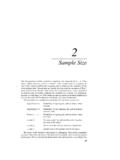
10 This combined effect offsets the per oC increase in output that occurs in dry air. Thus the net temperature effect in soil is a decrease in output of the O2 sensor by per oC increase in temperature. For example, if an O2 sensor were calibrated to read O2 at 25 C then the sensor would read O2 at 30 C [ + *(30-25)] and O2 at 20 C [ + *(20-25)]. The equation to correct O2 measurements in soil for temperature is: % O2 = measured % O2 + % O2 / C * (measured C calibrated C). 6 Example of Temperature Correction in Soil The Figure below shows simultaneous O2 in soil and temperature measurements, and the temperature correction described above applied to the O2 measurements and the pressure-corrected O2 measurements. As with the pressure correction, the data show the improvement in the measurement as a result of the temperature correction. When both corrections are applied the standard deviation is O2.