Transcription of Abuja Declaration ten years after - World Health …
1 The Abuja Declaration : Ten years On 2001 Promises of commitment and solidarity In September 2000, 189 heads of state adopted the Millennium Declaration designed to improve social and economic conditions in the World 's poorest countries by 2015. Subsequently, a set of eight goals were devised, drawing on the Millennium Declaration , as a way of tracking progress. Three of these relate specifically to Health ; two more have Health components. In April 2001, heads of state of African Union countries met and pledged to set a target of allocating at least 15% of their annual budget to improve the Health sector.
2 At the same time, they urged donor countries to "fulfil the yet to be met target of of their GNP as official Development Assistance (ODA) to developing countries".1 This drew attention to the shortage of resources necessary to improve Health in low income settings. At that time, the median level of general government Health expenditure from domestic resources (GGHE-FS)2 in African Union Countries was very close to US$103 with a thousand-fold difference between the minimum (US$ ) and maximum (US$380). In terms of ODA, five of the 22 donors then reporting to the OECD were already giving at least of their Gross National Income (GNI) with an average (unweighted) of %.
3 4 1 The Abuja Declaration quoted the target of GNP but we recognize that many donor countries express their targets in terms of GNI. 2 For the first time, this report presents GGHE from exclusively domestic financing sources (FS) using data collated from reports of national Health accounts and official documents of ministries of finance, central banks and national census and statistics offices as well as mission reports and studies from the International Monetary Fund (IMF) and the World Bank. Health expenditures conform to the boundaries of National Health Accounts (NHA).
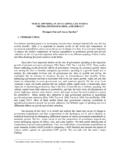
4 Domestic financing resources come from the general government (not necessarily limited only to ministries of Health ) and exclude grants and other forms of official development aid. Other reports have generally referred to GGHE as a financing agent. 3 Expressed in real 2009 US$ 14 2011 Today's reality and potential Table 1 shows progress since 2001 in the African Union countries for indicators for health5 and government Health expenditures. Table 1. Abuja Declaration and Health MDG Status Indicators, after 10 yearsper capita>33US$per capita=<33US$per capita>33US$per capita=<33US$per capita>33US$per capita=<33US$Number of countriesSeychelles (MIC)**EritreaAlgeria (MIC)MadagascarRwandaEgypt (MIC)Tunisia (MIC)Cape VerdeOn track Health MDGs124 100 Off track Health MDGs7172 5 0 7 Botswana (MIC)Burkina FasoMauritius (MIC)Dem Rep CongoBeninGabon (MIC)BurundiNamibia (MIC)EthiopiaCentral African RepublicSouth Africa (MIC)CameroonKenyaGambiaSwaziland (MIC)
5 ChadNigerGuineaAngola ComorosUnited Republic of TanzaniaMalawiSao Tome and Principe CongoMauritaniaLesothoC te d'IvoireTogoDjiboutiGhanaGuinea BissauLiberiaMaliMozambiqueNigeriaSenega lUgandaZambiaNumber of countries8196 6 0 72009**>2000 Health share of total spending of government as a source 2009**=2000 Health share of total spending of government as a source 2009**<2000 Health share of total spending of government as a source * Excludes Libya, Somalia, Equatorial Guinea, Sierra Leone, Sudan and Zimbabwe due to lack of data or difficulty in interpreting trend.
6 Morocco not part of Abuja Declaration ** When 2009 data were not available, the latest available in the country were used** Health MDG status for Seychelles is based on "Seychelles Millennium Development Goals: Status Report 2010" and UNAIDS Country situational analysis ( #key%20achievement)83846 Only eight countries are on track with respect to the Health Millennium Development Goals(MDGs). Most countries are achieving less than 50% of the gains that would be required to reach the goals by 2015, with progress on MDG 5 (maternal Health ) being particularly slow.
7 Twenty-seven countries have increased the proportion of total government expenditures allocated to Health (GGHE/GGE) since 2001. However, only Rwanda and South Africa have achieved the Abuja Declaration target of "at least 15%". Meanwhile, seven countries reduced their relative contributions of government expenditures to Health during the period. In the other twelve countries, there is no obvious trend upwards or downwards. 6 The median level of real per capital government spending from domestic resources on Health has increased from US$ 10 to US$ 14 over the decade, although the lowest observed level is still very low at US$ Interestingly, the upper level has fallen from US$ 380 to US$ 314.
8 The governments of 32 countries currently spend less than US$ 33 per capita on health7. Of the 14 countries that spend more than US$ 33 per capita, 71% are middle income countries. It is important to consider both the share of government spending devoted to Health as well as the overall level of spending when considering the ability of a country to meet the Health MDGs. The issue is less whether the ratio of GGHE/GGE is static, decreasing or increasing, than the fact that as long as per capita Health expenditure is low, countries will not achieve the Health MDGs.
9 However, if both the ratio 5 Health MDGs are expressed as on or off track based on their expected trajectories. Scoring methodology uses that of the Center for Global Development applied on UN data on the following selected indicators: child mortality rate for MDG 4, maternal mortality rate for MDG5 and HIV prevalence for MDG6. Methodology is based on the % attained over expected and a score of 1 means attainment is as expected for the time period, assuming a straight line trajectory from 1990 to 2015.
10 In this report, a score of at least 2 out of the three gets the country classified as on track for Health MDGs. 6 Static means a change of less than 1% 7 half of the average expected expenditure needed to meet the MDGs for low income countries in 2009 based on estimates from the High level task force on innovative financing for Health systems, expressed in 2009 US$) 2 3 and per capita real spending increase, the financial constraints to reaching the Health MDGs will obviously be reduced. International support The Abuja and MDG compacts were also opportunities for donor countries to express solidarity.