Transcription of ACLS Study Guide - Centegra Health System
1 acls Study Guide This purpose of this Study Guide is to assist you in successfully completing the AHA acls course. It includes sections on: ECG Rhythm Interpretation acls Drugs acls Algorithms ECG Rhythm Interpretation Electrical Conduction System SA Node. Primary pacemaker. Rate 60-100 The impulse travels through the Intraatrial Pathways to innervate the atria The impulse reaches the AV Node where electrical activity is delayed to allow for more complete filling of ventricles. AV Junction is comprised of the AV Node and the Bundle of His. Secondary pacemaker. Rate 40-60 The impulse then travels into the Right and Left Bundle branches.
2 Conducts electrical activity from Bundle of His to Purkinje Network. The Purkinje Network are fibers that spread throughout the ventricles, that carry impulses directly to ventricular muscle cells. Our last pacemaker site. Rate 20-40 P wave: Represents Atrial depolarization PRI: Represents the time it takes the impulse to travel from the SA Node through the intraatrial pathways in atria to the AV junction and the delay at the AV node. Interval from start of P wave to start of QRS, measures sec QRS: Represents conduction of impulse from Bundle of His through the ventricular muscle.
3 Represents ventricular depolarization. Should measure less than sec T wave: Follows ST segment. Slightly rounded, positive deflection Represents ventricular repolarization, resting phase of cardiac cycle Absolute Refractory Period: No outside stimulus can cause cells to depolarization From beginning of the QRS complex to the middle of the T wave Relative Refractory Period: A dangerous period. A strong outside stimulus can initiate depolarization of the only partially recharged cells. Possibly causing a lethal arrhythmia From the middle of the T wave to its end 5 Steps for Analyzing a Strip: Heart Rate: Bradycardia <60, Normal 60-100, Tachycardia >100 Count the # of R waves in a 6 second rhythm strip, then multiply by 10 Find an R wave that lands on a bold line.
4 Count the # of large boxes to the next R wave. If the second R wave is 1 large box away the rate is 300, 2 boxes - 150, 3 boxes - 100, 4 boxes - 75, 5 boxes 60 Divide 300 by the number of large boxes separating the R waves Heart Rhythm: Look at the R R distances, are they regular or irregular P Wave: Are there P waves? Do the P waves all look alike? Do the P waves occur at a regular rate? Is there one P wave before each QRS PR Interval: Is the PRI between Is it consistent across the strip? If it varies is there a pattern? QRS Complex: Do all of the QRS Complexes look alike? Are they regular?
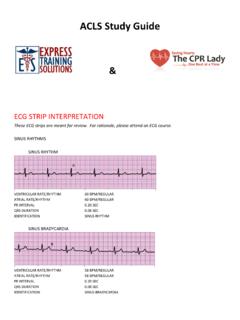
5 Is the duration Normal Sinus Rhythm This rhythm represents the normal state with the SA node functioning as the lead pacer with normal conduction through the heart. The intervals should all be consistent and within normal ranges. Looking at the ECG you'll see that: Rhythm - Regular Rate - (60-100 bpm) QRS Duration - Normal P Wave - Visible before each QRS complex P-R Interval - Normal (<5 small squares. Anything above and this would be 1st degree block) Indicates that the electrical signal is generated by the sinus node and travelling in a normal fashion in the heart. Sinus Bradycardia The sinus beats are slower than 60 BPM.
6 The origin may be in the SA node or in an atrial pacemaker. This rhythm can be caused by vagal stimulation leading to nodal slowing, or by medicines such as beta blockers, and is normally found in some well-conditioned athletes. The QRS complex, and the PR interval may slightly widen as the rhythm slows below 60 BPM. However, they will not widen past the upper threshold of the normal range for that interval. For example, the PR interval may widen, but is should not widen over the upper of seconds Looking at the ECG you'll see that: Rhythm - Regular Rate - less than 60 beats per minute QRS Duration - Normal P Wave - Visible before each QRS complex P-R Interval - Normal Usually benign and often caused by patients on beta blockers Sinus Tachycardia It is an excessive heart rate above 100 beats per minute (BPM) which originates from the SA node.
7 Causes include stress, fright, pain, dehydration, and exercise. Not usually a surprise if it is triggered in response to regulatory changes ( shock). Looking at the ECG you'll see that: Rhythm - Regular Rate Usually between 100 150 beats per minute QRS Duration - Normal P Wave - Visible before each QRS complex P-R Interval - Normal The impulse generating the heart beats are normal, but they are occurring at a faster pace than normal. Seen during exercise Atrial Flutter A single irritable focus in the atria fires in a rapid repetitive fashion at a rate of 150 350 beats/min. The F waves appear in a saw toothed pattern such as those in this ECG.
8 The QRS rate is usually regular and the complexes appear at some multiple of the P-P interval. Looking at the ECG you'll see that: Rhythm Usually regular Rate Usually fast 110-150 beats per minute QRS Duration - Usually normal P Wave - Replaced with multiple F (flutter) waves, usually at a ratio of 2:1 (2F - 1 QRS) but sometimes 3:1 P Wave rate - 300 beats per minute P-R Interval - Not measurable Atrial Fibrillation Atrial fibrillation is the chaotic firing of numerous atrial pacemaker cells in a totally haphazard fashion. The result is that there are no discernible P waves. And the QRS complexes are innervated haphazardly in an irregularly irregular pattern.
9 The ventricular rate is guided by occasional activation from one of the pacemaking sources. Because the ventricles are not paced by anyone site, the intervals are completely random. Looking at the ECG you'll see that: Rhythm - Irregularly irregular Rate - usually 100-160 beats per minute but slower if on medication QRS Duration - Usually normal P Wave - Not distinguishable as the atria are firing off all over P-R Interval - Not measurable The atria fire electrical impulses in an irregular fashion causing irregular heart rhythm Supraventricular Tachycardia (Narrow complex Tachycardia) (SVT) SVT is a narrow complex tachycardia originating above the ventricles.
10 SVT can occur in all age groups. Looking at the ECG you'll see that: Rhythm - Regular Rate - > 150 beats per minute QRS Duration - Usually normal P Wave - Often buried in preceding T wave P-R Interval - Depends on site of supraventricular pacemaker 1st Degree AV Block 1st Degree AV block is caused by a conduction delay through the AV node but all electrical signals reach the ventricles. This rarely causes any problems by itself and often trained athletes can be seen to have it. The normal P-R interval is between to in length, or 3-5 small squares on the ECG. Looking at the ECG you'll see that: Rhythm - Regular Rate - Normal QRS Duration - Normal P Wave - Ratio 1:1 P Wave rate - Normal P-R Interval - Prolonged (>5 small squares) 2nd Degree Block Type 1 (Wenckebach) Mobitz Type I is also know as Wenckebach (pronounced WEEN-key-bock).


![[Type here] - Learn ACLS](/cache/preview/9/f/5/5/b/2/7/3/thumb-9f55b273c311f8a714c282fe77461ecc.jpg)

