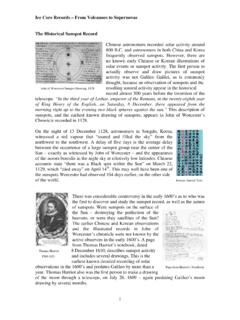
Transcription of ACTIVITY 2: SUNSPOT NUMBER VARIATIONS Guide to …
1 1 Teacher Guide , ACTIVITY 2: SUNSPOT NUMBER VARIATIONS Space Science Institute, 1999. All Rights 2: SUNSPOT NUMBER VARIATIONSS aturn and its MoonsIts orbit around the SunOther factors affectingdensity and mass QQQQQQQQ This ACTIVITY focuses on one feature of the Sun seen in the last ACTIVITY , sunspots , andexamines their variation over times much greater than a solar rotation (about 25days). It functions as an EXPLORE phase in to TeachersGoal: Students learn aboutsunspot VARIATIONS and thesolar cycle, and are able topredict future solar minimumsand maximums. One copy of the student ACTIVITY information and worksheet (included) Table of yearly SUNSPOT numbers (Charts #1 and #2, included) A photocopy of the student ACTIVITY , preferably one copy per student. Providethe worksheet first, then the rest of the text once students have discussed theirinitial ideas Three sheets of graph paper per group of 3 students Colored pencils Ruler ScissorsMATERIALS NEEDED1 23 99 3 81 9 10 92 38 019 238 20 3 94 85 28 40 5 582 90 59 2 Teacher Guide , ACTIVITY 2: SUNSPOT NUMBER VARIATIONS Space Science Institute, 1999.
2 All Rights :DISCUSS: Students discuss what they know about sunspots and their VARIATIONS . Thisallows them to revisit some material from ACTIVITY 1. Many may know that the numberof sunspots changes over time, or even that the NUMBER changes in a regular cycle. Stu-dents then report a few ideas from their groups, facilitated by the : Provide students with ACTIVITY materials and text. Students work in groupsof three. They begin by reading about sunspots and their relationship to Earth. Eachstudent prepares a graph using the procedure in the student worksheet. They plot thenumber of sunspots for each year using Charts #1 and #2, join their graphs and observethe resulting pattern. The teacher should assist students who are having difficultiesproducing a correct graph of the data to ensure that all students who wish to produce acorrect graph do : Since they will be taping these graphs together, make certain that all three stu-dents in each group use the same scale for both the time in years (x-axis) and sunspotnumbers (y-axis).
3 REFLECT: At this point, the teacher should call on several students to report theirobservations. After discussing the observations, tell them that the pattern they see iscalled the Solar Cycle. Solar cycles have been numbered beginning with the minimumthat occurred about 1755. A cycle includes an increase and the following decrease insunspot numbers. Cycle NUMBER 22 peaked in 1990. The next two SUNSPOT cycles arenumbered 23 and 24. Students are to NUMBER the cycles on their graphs. Point out tostudents that during the Maunder Minimum (from 1645 to 1715), the solar cycle almostdisappeared as no sunspots were seen. The link between climate (long-term VARIATIONS inthe weather) and sunspots may have something to do with the maximum NUMBER ofsunspots in a cycle, but scientists do not completely understand the : Students use their graphs to answer various questions and predict aspects of thenext SUNSPOT for modifying this ACTIVITY :As it is written, the ACTIVITY for plotting SUNSPOT numbers takes a class of 30 students, whomeet in 45 minute periods, about three or four days to complete.
4 To reduce the amount oftime that you spend on the ACTIVITY to about two days, you might try the following sug-gestions Have the students only plot every other point. Assign students to finish plotting the data as homework. For smaller classes (fifteen or less) and for an ACTIVITY that gets students out oftheir seats and moving about, you might try the following procedure:XXXXXXXXXXXXXXXXXXXXXXXXXXXXXX XX3 Teacher Guide , ACTIVITY 2: SUNSPOT NUMBER VARIATIONS Space Science Institute, 1999. All Rights butcher paper long enough to graph the accompanying data (perhaps cover one wallof a classroom).1. Prepare the butcher paper in advance by drawing the horizontal axis along the bottomand labeling it Time in Years. NUMBER from 1700 to present. Draw a vertical axis onthe left hand side of the butcher paper and label it SUNSPOT Numbers. NUMBER from 1to 200. Write a Cut out the individual dates or series of dates for individual students to Have students graph the SUNSPOT numbers that you have prepared.
5 (This is mostexciting when students have SUNSPOT numbers that are not sequentially, but randomlydated so that they must move around to find the dates on the horizontal axis.) When allof the points are plotted, have several students connect the data Ask students to observe the resulting pattern, answer the questions that accompanythis ACTIVITY , then draw their prediction for the next two SUNSPOT cycles on the graph usinga dashed ------ More: To add an interdisciplinary or a personal touch, ask students to markhistorical events or dates of personal interest such as Guide , ACTIVITY 2: SUNSPOT NUMBER VARIATIONS Space Science Institute, 1999. All Rights :2ytivitcArofcirbuRgnirocS_____:emaNtned utS)"3"aseveihcatnedutsfitemlaog(tnemsse ssAlaudividnI)s( , ,snoitseuqnoitanalpxeelbanosaertub, ,snoitseuqnoitanalpxeelbanosaertub, ",3" )"2"aseveihcapuorgfitemlaog(tnemssessApu orG)s( ;tnedutsrepypocenoekaM:ESUDETSEGGUS1 Student Guide , ACTIVITY 2: SUNSPOT NUMBER VARIATIONS Space Science Institute, 1999.
6 All Rights Guide to ACTIVITY 2: SUNSPOT NUMBER VariationsProblem: What pattern(s) emerge when SUNSPOT numbers are plotted over aperiod of time?IntroductionA student s dream comes true! On a quiet, mild, mid-afternoon, the overhead lightsflicker just a little. A few minutes later, the same lights dim faintly, then suddenly all isdark. A hoot of delight reverberates throughout the school as students hopes for anunexpected vacation rise. What happened to cause this sudden surprise?If you live in the north, perhaps it was due to a sudden snowfall or sleet storm. If youlive in the south, maybe it was a power overload on a hot day. But, this is a mild, quietafternoon. What could cause a dramatic power outage? Just a few short decades ago wewould never have suspected that our ultimate energy source, the Sun, was the culprit!How could that be?That reliable sphere of glowing gas that rises daily in the east and sets in the west sendsus visible light that arrives on Earth after about 8 minutes of travel through space.
7 Be-sides its dazzling brightness, the Sun s next most obvious features are the appearance ofdark, cool areas called sunspots that can be seen when the Sun s image is projected onto apiece of white cardboard through a pin-hole (never look at the Sun directly!!). Sunspotsare huge magnetic field bundles that are shaped somewhat like a horseshoe magnetic fields result in cooler, darker regions on the surface of the Sun that wesee as sunspots . sunspots are sources of a tremendous amount of energy including solarflares, the most violent events in the solar system. In a matter of minutes, a large flarereleases a million times more energy than the largest and the resultingsolar flares affect us, hereon Earth. In fact, the morewe learn about sunspots andsolar flares, the greater theirinfluence on Earth appearsto be. Solar flares emitradiation that includes X-rays and ultraviolet rays,and charged particles calledprotons and electrons. Thisradiation surge may damageelectrical power systems,interfere with telecommuni-cations, disrupt high-tech ship navigation systems, harm an astronaut in space, or createthe spectacular aurora (Northern and Southern lights).
8 Auroral curtains photographed by astronauts onNASA s STS-39 mission (courtesy of NASA)2 Student Guide , ACTIVITY 2: SUNSPOT NUMBER VARIATIONS Space Science Institute, 1999. All Rights , scientists at NOAA s Space Environment Center in Boulder, Colorado, conductresearch in space physics and develop new techniques for forecasting solar events likesolar flares. The Space Environment Services Center is the national and world warningcenter for these disturbances, called space weather. Space weather affects both peopleand equipment not only in airline and space travel, but also in Earth-based jobs such aslong-line telephone communication systems, pipeline operations, and electric years of study, we now know that the chances of a sudden surge in radiation onEarth caused by a solar flare is related to an increase in the NUMBER and complexity ofsunspots. Therefore, researchers plot average SUNSPOT numbers over a period of time sothat we know when to expect the next series of disruptive, potentially dangerous solarflares.
9 The SUNSPOT NUMBER (also called the Wolf NUMBER after Rudolph Wolf, whodevised the method) is not actually the NUMBER of sunspots on the Sun. It is calculatedwith a formula that does depend on the NUMBER of visible sunspots recorded at selectedobservatories around the mysterious connection betweensunspots and life on Earth has to do withclimate. During a period from 1645 to 1715known as the Maunder minimum, almost nosunspots were seen. During that same time,Earth s Northern Hemisphere experienced the Little Ice Age as average temperaturesdipped and rivers froze. What is the connec-tion? Scientists are not certain, but sunspotsmust be telling us something important abouthow the Sun works and produces , as our knowledge of the interactionbetween the Sun and Earth improves and ouruse of the space environment increases, spaceweather forecasting becomes more we may feel, see, or hear nothingunusual, our electrical power may fail, our telecommunications may falter, and satellitesmay no longer function.
10 Some people may speak of mysterious, superstitious forces, butwe know that none other than our closest star, the Sun, is the culprit. And in the longterm, studying sunspots could help us solve the many mysteries of our nearest star mysteries that could mean life or death for planet Environment Forecast Center (courtesy of the Space Environment Center, NOAA)Europe experienced a Little Ice Age in theseventeenth century. This painting, Skating/Frozen River, recorded by Hendrick Avercamp isof an unusual freezing of Dutch Guide , ACTIVITY 2: SUNSPOT NUMBER VARIATIONS Space Science Institute, 1999. All Rights 2 STUDENT WORKSHEETP rocedure:1. Working in groups of three, read the text for this When all of you are done reading the text, obtain three sheets of graph paper (one foreach of you), colored pencils and a ruler from your teacher. Each of you will now com-plete a : Be sure to agree beforehand on what scale you will use (for example, eachvertical line might represent 1 year), because you will be taping these together once all graphs have been completed.