Transcription of Aerosol Statistics Lognormal Distributions and …
1 _____ TSI, TSI logo, Scanning Mobility Particle Sizer, SMPS, Engine Exhaust Particle Sizer, EEPS, Fast Mobility Particle Sizer, FMPS, Aerodynamic Particle Sizer, APS, Ultraviolet Aerodynamic Particle Sizer, and UV-APS are trademarks of TSI Incorporated. Aerosol Statistics Lognormal Distributions AND dN/dlogDp APPLICATION NOTE PR-001 Lognormal Distributions Standard Statistics based on normal Distributions are frequently not suitable for most airborne particle ( Aerosol ) size Distributions . Generally, Lognormal Distributions tend to be the best fit for single source aerosols.
2 There is no real theoretical reason as to why Aerosol size Distributions are log normal, it s merely empirically the best fit. When statistical analysis is applied to Aerosol size Distributions , it is routinely based on Lognormal Distributions . Lognormal Statistics are not widely used, and so this slightly skewed point of view from standard Statistics can be quite confusing to those who have not been exposed to it. Lognormal Distributions are most useful where the data range (the difference between the highest and lowest values) of the x-axis is greater than about 10.
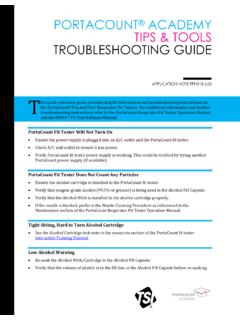
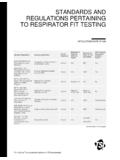
3 If the data range is narrow, the Lognormal distribution approximates a normal distribution . Example Aerosol DistributionLinear Scale - Diameter (nm)Concentration (particle/cm3) [e5] Example Aerosol Size DistributionLognormal Scale - Diameter (nm) Concentration (particle/cm3) [e5] Figure 1: a) Aerosol data displayed using a log scale for particle diameter and b) using a linear scale for particle diameter. -2- Lognormal Statistics Count Median Diameter (CMD) When statistically describing Lognormal Distributions , the geometric mean diameter (Dg) of normal Distributions is replaced by the count median diameter (CMD).
4 In Lognormal Distributions , the log of the particle size distribution is symmetrical, so the mean and the median of the Lognormal distribution are equal. The median of the Lognormal distribution and normal distribution are equal, since the order of the values does not change when converting to a Lognormal distribution . Therefore, for a Lognormal distribution , Dg = CMD. NnNnnngNDDDDCMDD/1321)(221 where: Dg = geometric mean diameter Di = midpoint particle size ni = number of particles in group i having a midpoint size Di N = ni, the total number of particles, summed over all intervals Geometric Standard Deviation ( g or GSD) In Aerosol Lognormal Distributions , the log of the particle diameter is normally distributed.
5 The normal, linear based standard deviation ( ) with which most are familiar with is replaced with the standard deviation of the logarithms, called the geometric standard deviation ( g or GSD). The geometric standard deviation is always greater than 1 ( g 1). 2/121)log(loglog NDDngiig where: g = geometric standard deviation (GSD) Di = midpoint particle diameter of the ith bin ni = number of particles in group i having a midpoint size Di N = ni, the total number of particles, summed over all intervals What Do the Lognormal Statistics Mean?
6 The geometric standard deviation describes how spread out the values are in the distribution . In a normal distribution , 95% of the particle diameters fall within Dp 2 . In a Lognormal distribution , 95% of the particle diameters fall within a size range expressed as: 10[logCMD 2log g] or 2gCMD < 95% of all particle diameters <2gCMD , if g = and CMD = 10nm; 95% of the particle diameters lie between 410= and 410 = 40nm. Monodisperse aerosols have narrow size Distributions and lower geometric standard deviation values ( g).
7 Polydisperse aerosols have wider size Distributions and higher geometric standard deviation values ( g). The geometric standard deviation value at which an Aerosol can be considered generally monodisperse is quite subjective, but a good rule of thumb is: Monodisperse: g Polydisperse: g > -3- Many scientists prefer a more stringent definition of monodispersity with g A g is considered highly monodisperse. Normalized Concentrations: dN/dlogDp Limitations of Concentration (dN) vs. Particle Diameter Data Displays As established above, Aerosol Distributions are predominantly Lognormal in character, so data is typically plotted on a Lognormal X-axis.
8 In the simplest technique, particle data is plotted as a function of the concentration (dN) for each particle size bin. The mode concentration of the size distribution is often estimated by the concentration in the peak bin. In Aerosol sizing instruments, the number of size bins is finite. This simple concentration vs. log particle diameter approach works well only if you are exclusively using one type of instrument, or if you are comparing instruments with identical resolution. However, if you try to compare Aerosol size Distributions taken of the same Aerosol using instruments of different resolutions, plots of concentration vs.
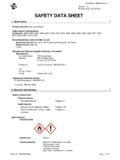
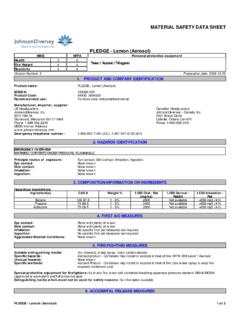
9 Particle diameter can be confusing. In the example below you will see two different plots of data taken with our Scanning Mobility Particle Sizer (SMPS ) Spectrometer. On the left the distribution is plotted using 64 channel resolution. On the right is the exact same data plotted with 32-channel resolution. At first glance, it looks like the Aerosol represented by the data on the right is roughly double the concentration. However, this is just an illusion from the difference in resolution. The concentration on the right is double because the width of the bin is twice as large as the channel on the left.
10 The Resolution Problem with Concentration vs. Particle Diameter Data Display The solution: dN/dlogDp The method statisticians use to avoid this problem is to plot the data using normalized concentration (dN/dlogDp). dN (or N) is the number of particles in the range (total concentration) and dlogDp (or logDp) is the difference in the log of the channel width. dlogDp is calculated by subtracting the log of the lower bin boundary from the log of the upper boundary for each channel (normalizing for bin width).