Transcription of African Americans in the United States, Michigan and ...
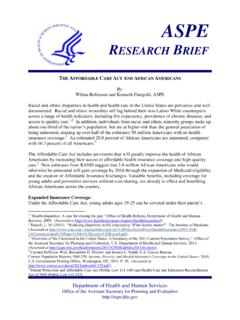
1 Center for Urban Studies February 2 0 0 2 Working Paper Series, No. 8 African Americans in theUnited states , Michigan andMetropolitan DetroitCenter for Urban Studies-February 2 0 0 2 Working Paper Series, No. 8 African Americans in theUnited states , Michigan andMetropolitan DetroitCenter for Urban StudiesWayne State UniversityDetroit, MI 48202 Center for Urban Studies-February 2 0 0 2W orking Paper Series, No. 8 Kurt Metzger, Research Director, Center for Urban StudiesJason Booza, Geographic Information Specialist, Center for Urban Studies 3 IntroductionData on race has been collected since the first decennial census in 1790(see Table 1). Blacks have been enumerated in every census. According to theCensus, the term Black or African american refers to people having origins inany of the black race groups of Africa.
2 It includes people who reported Black, African Am., or Negro or wrote in entries such as African american , AfroAmerican, Nigerian, or 1 Categories for Collecting Data onBlacks in the Census: 1860-2000 Census Year1860 BlackMulatto1870 1 BlackMulatto1880 BlackMulatto1890 BlackMulattoQuadroonOctoroon1900 Black (of Negro decent)1910 BlackMulatto1920 BlackMulatto1930 Black1940 Black1950 Negro1960 Negro1970 Negro or Black1980 Black or Negro1990 Black or Negro2000 Black, African american , or NegroSource: 200 Years of Census Taking: Population And Housing Questions 1790-1990. Department of Commerce. Bureau of the In 1890, mulatto was defined as a person who was three-eighths to five-eighths black. A quadroon was one-quarter black and an octoroon one-eighth PerspectiveLet us first look at how blacks identified themselves with regard to the singleand multiple race options.
3 In the total population, million people, percent, reported only black. An additional million people reportedblack and at least one other race. Within this group, the most commoncombinations were Black and White (45 percent), Black and Some otherrace (24 percent), Black and american Indian and Alaska Native (10 per-cent), and Black and White and american Indian and Alaska Native (6percent). Thus, million, or percent of the total population, reportedblack alone or in combination with one or more other races. [Unless specifi-cally noted, the 2000 counts of blacks used in the remainder of this paper willbe that of blacks alone. This is generally regarded to be more comparable forcomparison purposes with previous censuses.]Blacks increased in number from 29,980,996 in 1990 to 34,658,190 in represented a gain of percent, slightly above the percent growththat the nation experienced in total population.
4 Blacks ended the 20thcentury by returning to the region that they spent most of the century return reinforces the South s distinct racial profile as a mostly white-blackregion. 2 Census 2000 numbers show that the non-Hispanic black population ofthe South surged in the 1990s by 3,575,211 people more than in the otherthree regions of the United states combined. As shown in Table 2, the South,while containing just fewer than 36 percent of the nation s population,accounted for almost 55 percent of the country s blacks, and 58 percent of thetotal increase in the country s black population. The South s gain during the1990s was roughly double the number of blacks that the South gained in the 41980s ( million) and well above the gain for the 1970s ( million)
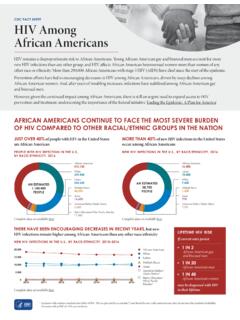
5 , whenblacks began returning to the 22000 Black Population by Regionand Division Total PopulationBlack or African AmericanPercent of TotalPercent of Black TotalUNITED STATES281,421,906 34,658,190 Northeast53,594,378 6,099,881 New England13,922,517 719,063 Middle Atlantic39,671,861 5,380,818 Midwest64,392,776 6,499,733 East North Central45,155,037 5,405,418 West North Central19,237,739 1,094,315 South100,236,820 18,981,692 South Atlantic51,769,160 11,026,722 East South Central17,022,810 3,418,542 West South Central31,444,850 4,536,428 West63,197,932 3,076,884 Mountain18,172,295 523,283 Pacific45,025,637 2,553,601 Source: Census Bureau, Census 2000 Redistricting Data ( 94-171) Summary File for states and Census 2000 Redistricting Summary File for Puerto Rico, Tables PL1 and strength of the South is clearly evident when one looks at the state 3 provides a listing of the top 15 states for blacks, with their associatedranking on total population.
6 It is apparent that the rankings of southernstates are very different for blacks than for totals. Georgia, which ranks 10thoverall, has the third largest count of black residents. The largest differencesshow for Louisiana (22nd and 9th), South Carolina (26th and 14th) andAlabama (23rd and 15th).Number RankNumber RankNew York18,976,457 3 3,014,385 1 Texas20,851,820 2 2,404,566 2 Georgia8,186,453 10 2,349,542 3 Florida15,982,378 4 2,335,505 4 California33,871,648 1 2,263,882 5 Illinois12,419,293 5 1,876,875 6 North Carolina8,049,313 11 1,737,545 7 Maryland5,296,486 19 1,477,411 8 Louisiana4,468,976 22 1,451,944 9 Michigan9,938,444 8 1,412,742 10 Virginia7,078,515 12 1,390,293 11 Ohio11,353,140 7 1,301,307 12 Pennsylvania12,281,054 6 1,224,612 13 South Carolina4,012,012 26 1,185,216 14 Alabama4,447,100 23 1,155.
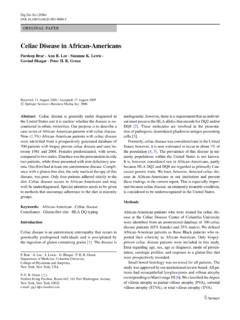
7 930 15 Total PopulationBlack PopulationTable 3 Top 15 states Ranked by BlackPopulation in 2000 While the largest counties in the United states tend to be the leaders in termsof numbers of black residents, with only Prince George s County, Maryland,having a total population of less than one million, it is small southerncounties that are the leaders when it comes to the black share of total 5population (see Table 4). Alabama and Mississippi account for eight of the top10 each having two counties with shares over 80 4 Top 10 Counties Ranked By Numberand Percent of Blacks, 2000As with counties, the largest cities tend to lead in black population as York comes in first on both measures, while Los Angeles, ranked 2ndoverall, falls to number 7 for blacks, due to its large Hispanic and Asianpopulations.
8 Chicago ranks second in number of blacks, while Detroit, ranked10th overall, moves up to number 3 in number of blacks, due to its highconcentration. In fact, Detroit ranks second in its share of black residents( percent for black alone) among all cities in the United states withpopulations of 100,000 or greater. Only Gary, Indiana, has a higher share ( ). Michigan , Its metropolitan Areas and CountiesThe 2000 Census found Michigan to have a black population of 1,402,742,which constitutes percent of the state s total population (see Table 5).During the 1990s Michigan gained 119,303 blacks. This represented a greatergain than that of the 1980s, when Michigan s population increased by less percent overall, but much less than previous decades (see Table 6).
9 metropolitan areas house 82 percent of the state s total population, but 98percent of the state s black population (see Table 7). The Detroit PrimaryMetropolitan Statistical Area (PMSA)3 accounts for 72 percent of the state smetropolitan black population, and, within the Detroit PMSA, Wayne Countyholds 85 percent of the PMSA total, with a black population of 864,627,representing 42 percent of its total population. Oakland County runs a distantsecond to Wayne County with 119,708 blacks, followed by Genesee County. Noother county in the state has more than 50,000 blacks (see Table 8).RankCountyStateTotal PopulationBlack PopulationPercent Black1 Cook CountyIL5,376,741 1,405,361 2 Los Angeles CountyCA9,519,338 930,957 3 Kings CountyNY2,465,326 898,350 4 Wayne CountyMI2,061,162 868,992 5 Philadelphia CountyPA1,517,550 655,824 6 Harris CountyTX3,400,578 628,619 7 Prince George's CountyMD801,515 502,550 8 Bronx CountyNY1,332,650 475,007 9 Miami-Dade CountyFL2,253,362 457,214 10 Dallas CountyTX2,218,899 450,557 1 Jefferson CountyMS9,740 8,424 2 Macon CountyAL24,105 20,403 3 Claiborne CountyMS11,831 9,951 4 Greene CountyAL9,974 8,013 5 Petersburg cityVA33,740 26,643 6 Holmes CountyMS21,609 16,997 7 Hancock CountyGA10,076 7.
10 835 8 Lowndes CountyAL13,473 9,885 9 Sumter CountyAL14,798 10,827 10 Bullock CountyAL11,714 8,564 RANKING BY NUMBER OF BLACKSRANKING BY PERCENT OF BLACKS 6 Table 7 Michigan metropolitan Area BlackPopulation, 2000 AreaTotal PopulationBlack PopulationPercent BlackAnn Arbor PMSA578,736 42,075 Lenawee County98,890 2,033 Livingston County156,951 716 Washtenaw County322,895 39,326 Benton Harbor MSA162,453 25,729 Berrien County162,453 25,729 Detroit PMSA4,441,551 1,012,262 Lapeer County87,904 709 Macomb County788,149 21,151 Monroe County145,945 2,686 Oakland County1,194,156 119,708 St. Clair County164,235 3,381 Wayne County2,061,162 864,627 Flint PMSA436,141 88,356 Genesee County436,141 88,356 Grand Rapids-Muskegon-Holland MSA1,088,514 77,660 Allegan County105,665 1,315 Kent County574,335 49,994 Muskegon County170,200 23,971 Ottawa County238,314 2,380 Jackson MSA158,422 12,396 Jackson County158,422 12,396 Kalamazoo-Battle Creek MSA452,851 41,819 Calhoun County137,985 14,912 Kalamazoo County238,603 22,968 Van Buren County76,263 3,939 Lansing-East Lansing MSA447,728 35,510 Clinton County64,753 401 Eaton County103,655 5,397 Ingham County279,320 29,712 Saginaw-Bay City-Midland MSA403,070 40.