Transcription of AGGREGATE PROGRAM DATA
1 COMMISSION ON ACCREDITATION IN PHYSICAL THERAPY EDUCATION| 1111 N. FAIRFAX ST. ALEXANDRIA, VA AGGREGATE PROGRAM data 2017 2018 PHYSICAL THERAPIST EDUCATION programs FACT SHEETS 2017 18 Fact Sheets Physical Therapist Education programs 1 Introduction & Contents 2017 18 Fact sheet Physical Therapist Education programs This Fact sheet is designed to provide the education community with current and historical information about physical therapist education programs , students and faculty. The data included in this Fact sheet is taken from the following sources: THE 2017 ANNUAL ACCREDITATION REPORT, COMPLETED DECEMBER 2017 BY US ACCREDITED programs THE 2016, 2015, 2014, 2012, 2011, 2010, 2009, 2008, 2007, AND 2006 ANNUAL ACCREDITATION REPORTS THE 2000, 2002, AND 2004 BIENNIAL ACCREDITATION REPORTS PREVIOUS SURVEYS OF THE PT EDUCATIONAL programs CONDUCTED BY THE EDUCATION DIVISION DEPARTMENT OF ACCREDITATION RECORDS LICENSURE PASS RATE INFORMATION PROVIDED BY THE FSBPT ON APRIL 2005, APRIL 2006, APRIL 2007, APRIL 2011, APRIL 2012, APRIL 2014, APRIL 2015, APRIL 2016, APRIL 2017 AND DECEMBER 2017.
2 Unless otherwise indicated, the data reflects accredited and developing physical therapist education programs in the United States for the academic year 2017 18. All uses of this data should reference the Commission on Accreditation in Physical Therapy Education (CAPTE) as the source of the data and acknowledge that CAPTE bears no responsibility for interpretations presented or conclusions reached based on analysis of the data . Symbols Many tables in this volume use a series of symbols to alert the reader to special statistical notes. These symbols, and their meanings, are as follows: Not available. Not applicable. # Rounds to zero. Reporting standards not met. Originally Published March 12, 2018 Last Updated October 23, 2018 (updates made after the date of original publication will be highlighted in yellow) CAPTE s Home Page address is CAPTE s Resource Documents address is This publication is only available online.
3 To download, view, and print the report as a PDF file, go to CAPTE s Resource Documents address shown above. CONTENT CONTACT TEJ CHANA SR. DATABASE SPECIALIST 2017 18 Fact Sheets Physical Therapist Education programs 2 Introduction & Contents Glossary Faculty All faculty including core and associated. Associated Faculty Associated faculty are those individuals who have classroom and/or laboratory teaching responsibilities in the curriculum and who are not core faculty or clinical education faculty. The associated faculty may include individuals with full-time appointments in the unit in which the professional PROGRAM resides, but who have primary responsibilities in programs other than the professional PROGRAM . Core Faculty Core faculty are those individuals appointed to and employed primarily in the PROGRAM .
4 Members of the core faculty typically have full-time appointments, although some part-time faculty members may be included among the core faculty. The core faculty are generally the group with the responsibility and the authority related to the curriculum. Includes PROGRAM Directors and DCEs; does not include associated faculty. Other Faculty Core faculty excluding PROGRAM Directors and Clinical Education Coordinators (DCEs & ACCEs). Table of Contents Glossary .. 2 THE AVERAGE PHYSICAL THERAPIST PROGRAM .. 3 PROGRAM data .. 6 Numbers of programs .. 6 Distribution of programs .. 7 Financing of Professional Education .. 8 Measures of PROGRAM Length .. 9 Credits Required .. 10 Clinical Education .. 11 Outcomes .. 12 STUDENT data .. 13 Admissions .. 13 15 Graduates .. 16 FACULTY data .. 17 Number of Faculty.
5 17 Ratios .. 17 Workload .. 17 Scholarship & Grants .. 18 Clinical Specialists .. 18 Faculty Demographics .. 19 Degrees Held, Rank, Tenure Status .. 19 Salaries .. 22 2017 18 Fact Sheets Physical Therapist Education programs 3 Average PROGRAM data THE AVERAGE PHYSICAL THERAPIST PROGRAM 2015-2016 2016-2017 2017-2018 Type of Institution (% of Total programs ) Private ( ) Private ( ) Private ( ) Geographic Location (% of Total programs ) South Atlantic (19%) South Atlantic (20%) South Atlantic (21%) Top 3 States (States with Highest % of Total programs ) (NY, PA, CA-TX same total) (NY, PA, CA-TX same total) (NY, PA, CA-TX same total) Costs (Mean) Public Private Public Private Public Private Annual Tuition 15,404 33,411 17,175 35,199 17,742 35,534 Annual Fees 2,445 1,501 2,490 1,575 2,340 1,951 Total Cost of Professional PROGRAM *Room & Board Excluded 48,135 105,229 59,210 105,857 60,627 109,099 Admissions (Mean) 2015 2016 2017 Planned Class Size 50 45 45 Total Applicants 494 500 502 Applicants Qualified 326 336 330 Applicants Offered Place 81 87 86 Applicants Enrolled 44 44 46 GPA of Enrollees Enrollment (Mean) Total Students Enrolled 124 133 136 Percent Women Enrolled 62% 62% 62% Percent Minority Enrolled 19% Outcomes (US programs ) Degree Awarded (% of Total programs ) DPT ( ) DPT ( )
6 DPT (100%) Graduates Per PROGRAM (Mean) 43 Graduation rate (Mean) ( 14) ( 15) ( 16) Percent Graduates Minority (Mean) Licensure Pass Rate, First Time Takers (Mean) ( 14) 91%( 15) ( 16) Licensure Pass Rate, Ultimate (Mean) Employment Rate, Post 6 Months Graduation (Mean) 99% 99% 99% Length of PROGRAM (Professional Phase) Curricular Format (% of Total programs ) 4+3 ( ) 4+3 ( ) 4+3 ( ) Weeks in Class (Didactic/Laboratory) (Mean) 95 Weeks in Class (Full-Time Clinical Education) (Mean) 34 36 Total Weeks in PROGRAM (Mean) 2017 18 Fact Sheets Physical Therapist Education programs 4 Average PROGRAM data 2015-2016 2016-2017 2017-2018 Contact/Clock Hours (Didactic/Laboratory) (Mean) 1,869 1,882 -- Contact/Clock Hours (Clinical Education) (Mean) 1,440 1,535 -- Total Contact/Clock Hours in PROGRAM (Mean) 3,363 3,405 -- Curriculum (Mean) Academic Calendar Semesters (85%) Semesters (86%) Semesters ( ) Curricular Model Hybrid (76%) Hybrid (75%) Hybrid (76%) Total Semester Credits Required to Complete 113 120 115 Semester Credits in Professional Phase 102 95 95 Semester Credits in Prerequisite Phase 118 120 119 Clinical Education (Mean) Clinical Education Sites 415 581 579 Credentialed Clinical Instructors 53 53 53 Certified Clinical Instructors 26 27 29 Faculty (Mean) Full-Time Core Faculty Positions 10 11 11 Part-Time Core Faculty Positions 1 1 1 Associated Faculty Positions 8 Core Faculty to Student Ratio 1:11 1:12 1:12 Faculty to Student Ratio (Lab) 1:13 1:13 1.
7 13 Full-Time Core Faculty Characteristics (Mean) Director DCE Faculty** Director* DCE Faculty** Director* DCE Faculty** Age 59 49 49 65 55 40 55 Total Years as Faculty Member 12 Years as Faculty Member (Current PROGRAM ) 9 Full-Time Core Faculty Workload (%)
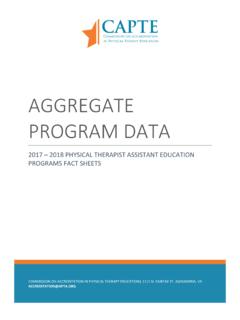
8 Workload Allotted to Teaching in Entry Level Workload Allotted to Service Workload Allotted to Clinical Practice 4 Workload Allotted to Scholarship 2017 18 Fact Sheets Physical Therapist Education programs 5 Average PROGRAM data - Not available. * Director refers to PROGRAM Director. ** Faculty refers to Other Faculty, excluding PROGRAM director and 18 Fact Sheets Physical Therapist Education programs PROGRAM data 6 Numbers of programs PROGRAM data Numbers of programs Figure 1 Number of Accredited and Developing PT programs Figure 2 Number of accredited p rograms by d egree o ffered 1979 2018 2302382412438121417050100150200250300350 4004502013201520162017 Number of ProgramsAccreditedDeveloping050100150200 2503007980818283848586878889909192939495 9697989900010203040506070809111213141516 1718 Master'sDPTT otal2017 18 Fact Sheets Physical Therapist Education programs PROGRAM data 7 Distribution of programs Distribution of programs Table 1 Distribution of accredited and developing p rograms b y geographical region 2012 1 8 [as of 3/2018]
9 States 2012 2013 2015 2016 2017 2018 South Atlantic DE, DC, FL, GA, MD, NC, PR, SC, VA, WV 42 44 47 53 54 54 Middle Atlantic NJ, NY, PA 41 41 44 46 46 47 East North Central IL, IN, MI, OH, WI 33 32 34 37 37 37 West North Central IA, KS, MN, MO, NE, ND, SD 23 22 25 26 26 26 West South Central AR, LA, OK, TX 19 20 23 25 25 26 New England CT, ME, MA, NH, RI, VT 17 17 17 17 18 18 Pacific AK, CA, HI, OR, WA 19 18 22 22 22 22 East South Central AL, KY, MS, TN 12 14 12 15 15 15 Mountain AZ, CO, ID, MT, NV, NM, UT, WY 12 9 15 14 14 14 Other Canada, Scotland 3 3 3 0 1 1 Total 221 220 242 255 257 260 Table 2 Distribution of accredited and developing programs in the US by regional accreditation 2012 1 8 2012 2013 2015 2016 2017 2018 North Central 70 70 75 79 79 79 Southern 58 54 64 73 73 74 Middle States 47 48 50 52 53 53 New England 17 18 18 18 19 19 Western 15 15 22 23 23 24 Northwest 10 9 10 10 10 10 Total 225 217 239 255 257 259 Table 3 Distribution of accredited and developing programs in the US by Carnegie Classification 2012 1 8 [as of 8 /2017 ] 2006 Classification 2012 2013 2015 2016 2017 2018 Doctoral/Research Universities 22 23 17 18 18 19 Research Universities (very high research activity) 32 33 39 39 39 39 Research Universities (high research activity)
10 30 27 35 35 35 35 Master s Colleges and Universities (larger programs ) 60 57 71 74 76 77 Master s Colleges and Universities (medium programs ) 19 19 15 17 17 17 Master s Colleges and Universities (smaller programs ) 11 11 12 13 13 13 Baccalaureate Colleges Arts & Sciences 2 1 1 2 2 2 Baccalaureate Colleges Diverse Fields 4 3 5 9 9 9 Special Focus Institutions Medical Schools and Medical Centers 40 32 30 31 31 31 Special Focus Institutions Other Health Professions Schools 6 4 12 14 12 14 Not Classified 5 6 2 2 3 3 Total 231 216 239 255 256 259 2017 18 Fact Sheets Physical Therapist Education programs PROGRAM data 8 Distribution of programs & Finances Figure 3 Distribution of accredited and developing programs in the US by type of institution 2011 1 8 Financing of Professional Education Table 4 Average annual tuition, fees, and other costs by type of institution FY 2017 1 8 ($)