Transcription of Agilent De-embedding and Embedding S-Parameter …
1 Application Note 1364-1 AgilentDe- Embedding and EmbeddingS-Parameter Networks Using aVector Network Analyzer2 IntroductionTraditionally RF and microwave com-ponents have been designed in pack-ages with coaxial interfaces. Complexsystems can be easily manufacturedby connecting a series of these sepa-rate coaxial devices. Measuring theperformance of these componentsand systems is easily performed withstandard test equipment that usessimilar coaxial interfaces. However, modern systems demand ahigher level of component integra-tion, lower power consumption, andreduced manufacturing cost. RFcomponents are rapidly shiftingaway from designs that use expen-sive coaxial interfaces, and are mov-ing toward designs that use printedcircuit board and surface mounttechnologies (SMT).
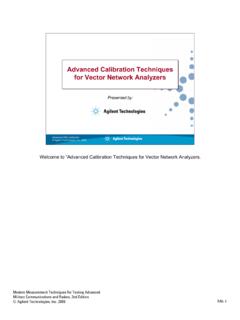
2 The traditionalcoaxial interface may even be elimi-nated from the final product. Thisleaves the designer with the prob-lem of measuring the performanceof these RF and microwave compo-nents with test equipment thatrequires coaxial interfaces. Thesolution is to use a test fixture thatinterfaces the coaxial and non-coax-ial transmission large variety of printed circuittransmission lines makes it difficultto create test equipment that can eas-ily interface to all the different typesand dimensions of microstrip andcoplanar transmission lines1 (Figure1). The test equipment requires aninterface to the selected transmissionmedia through a test characterization of thesurface mount device under test(DUT) requires the test fixture char-acteristics to be removed from themeasured results.
3 The test equip-ment typically used for characteriz-ing the RF and microwavecomponent is the vector networkanalyzer (VNA) which uses standard50 or 75 ohm coaxial interfaces atthe test ports. The test equipment iscalibrated at the coaxial interfacedefined as the measurement plane, and the required measurements areat the point where the surface-mount device attaches to the print-ed circuit board, or the deviceplane (Figure 2). When the VNA iscalibrated at the coaxial interfaceusing any standard calibration kit,the DUT measurements include thetest fixture the years, many differentapproaches have been developed forremoving the effects of the test fix-ture from the measurement, whichfall into two fundamental categories:direct measurement and de-embed-ding.
4 Direct measurement requiresspecialized calibration standardsthat are inserted into the test fix-ture and measured. The accuracy ofthe device measurement relies onthe quality of these physical uses a modelof the test fixture and mathematical-ly removes the fixture characteris-tics from the overall fixture De-embedding proce-dure can produce very accurateresults for the non-coaxial DUT,without complex non-coaxial cali-bration 1. Types of printed circuit transmission linesFigure 2. Test fixture configuration showing the measurement and device planes3 The process of De-embedding a testfixture from the DUT measurementcan be performed using scatteringtransfer parameters (T-parameter) this case, the de-embedded measurements can bepost-processed from the measure-ments made on the test fixture andDUT together.
5 Also modern CAEtools such as Agilent EEsofAdvanced Design System (ADS)have the ability to directly de-embedthe test fixture from the VNA mea-surements using a negation compo-nent model in the these approaches donot allow for real-time feedback tothe operator because the measureddata needs to be captured and post-processed in order to remove theeffects of the test fixture. If real-time de-embedded measurementsare required, an alternate technique must be is possible to perform the De-embedding calculation directly on the VNA using a different calibra-tion model. If we include the testfixture effects as part of the VNAcalibration error coefficients, realtime de-embedded measurementscan be displayed directly on the allows for real-time tuning ofcomponents without including thefixture as part of the following sections of this paperwill review S-Parameter matrices, signal flow graphs, and the errorcorrection process used in standardone and two-port calibrations on allAgilent vector network analyzerssuch as the E8358A PNA SeriesNetwork Analyzer.
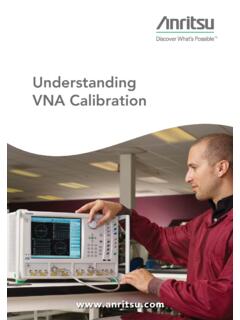
6 The de-embed-ding process will then be detailedfor removing the effects of a test fix-ture placed between the measure-ment and device planes. Alsoincluded will be a description onhow the same process can be usedto embed a hypothetical or virtual network into the measurement ofthe and signalflow graphsRF and microwave networks areoften characterized using scatteringor S-parametersof a network provide a clear physi-cal interpretation of the transmis-sion and reflection performance ofthe device. The S-parameters for atwo-port network are defined usingthe reflected or emanating waves, b1and b2,as the dependent variables,and the incident waves, a1and a2,as the independent variables (Figure 3).
7 The general equations for these waves as a function of theS-parameters is shown below:b1= S11a1+ S12a2b2= S21a1+ S22a2 Using these equations, the individ-ual S-parameters can be determinedby taking the ratio of the reflectedor transmitted wave to the incidentwave with a perfect terminationplaced at the output. For example,to determine the reflection parame-ter from Port 1, defined as S11, wetake the ratio of the reflected wave,b1to the incident wave, a1, using aperfect termination on Port 2. Theperfect termination guarantees thata2= 0 since there is no reflectionfrom an ideal load. The remaining S-parameters, S21, S22and S12, aredefined in a similar S-parameters completely definethe two-port network characteris-tics.
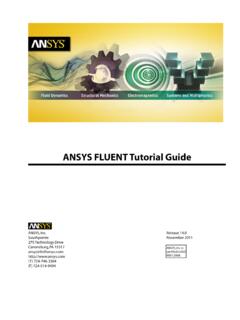
8 All modern vector network analyzers, such as the Agilent E8358A,can easily the measure the S-para-meters of a two-port 3. Definition of a two-port S-ParameternetworkAnother way to represent the S-para-meters of any network is with a signal flow graph (Figure 4). A flowgraph is used to represent and analyze the transmitted and reflect-ed signals from a network. Directedlines in the flow graph represent thesignal flow through the two-portdevice. For example, the signal flow-ing from node a1to b1is defined asthe reflection from Port 1 or two-port networks are cascad-ed, it can be shown that connectingthe flow graphs of adjacent networkscan be done because the outgoingwaves from one network are thesame as the incoming waves of of the complete cas-caded network can be accomplishedusing Mason s is the appli-cation of signal flow graphs that willbe used to develop the mathematicsbehind network De-embedding andmodifying the error coefficients inthe 4.
9 Signal flow graph representation of atwo-port S-Parameter network4 Defining the test fixtureand DUTB efore the mathematical process ofde- Embedding is developed, the testfixture and the DUT must be repre-sented in a convenient form. Usingsignal flow graphs, the fixture anddevice can be represented as threeseparate two-port networks (Figure 5). In this way, the test fix-ture is divided in half to representthe coaxial to non-coaxial interfaceson each side of the DUT. The twofixture halves will be designated asFixture A and Fixture B for the left-hand and right-hand sides of the fix-ture respectively. The S-parametersFAxx(xx = 11, 21, 12, 22) will beused to represent the S-parametersfor the left half of the test fixtureand FBxxwill be used to representthe right 5.
10 Signal flow graph representing thetest fixture halves and the device under test(DUT)If we wish to directly multiply thematrices of the three networks, wefind it mathematically more conve-nient to convert the S-parametermatrices to scattering transfermatrices or T-parameters. The math-ematical relationship between S-Parameter and T-parametermatrices is given in Appendix two-port T-parameter matrixcan be represented as [T], where [T]is defined as having the four para-meters of the we defined the test fixtureand DUT as three cascaded net-works, we can easily multiply theirrespective T-parameter networks,TA, TDUT and TB. It is only throughthe use of T-parameters that thissimple matrix equation be written inthis matrix operation will representthe T-parameters of the test fixtureand DUT when measured by theVNA at the measurement plane.