Transcription of AHRQ National Scorecard on Hospital-Acquired Conditions ...
1 January 2019 AHRQ National Scorecard on Hospital-Acquired Conditions Updated Baseline Rates and Preliminary Results 2014 2017 Summary Updated and new patient safety data for 2014 through 2017 continue to show a downward trend in the annual number of Hospital-Acquired Conditions (HACs). As reported in 2016, from 2010 through 2014, the rate of HACs decreased 17 percent. New and updated data for 2014 to 2016 show an 11 percent decrease. When preliminary data for 2017 are included, the decrease in HACs from 2014 to 2017 is 13 percent. From 2010 through preliminary 2017 data, the average annual reduction in the overall rate of HACs was approximately percent. For the trend beginning in 2014, methods were updated and a larger portion of hospital inpatients were included in the HAC calculations.
2 The 2014 rate started at 99 HACs per 1,000 hospital discharges and is estimated at 86 HACs per 1,000 discharges for 2017. In the method previously used, the 2010 rate was calculated as 145 HACs per 1,000 discharges and the 2014 rate was 121 HACs per 1,000 discharges. Both methods use the same 28 measures of patient safety events, including many types of Hospital-Acquired infections , adverse drug events, and injuries due to procedures, as well as pressure ulcers/pressure injuries and falls. The newly established baseline of 99 HACs per 1,000 discharges in 2014 equates to approximately 2,940,000 HACs among all hospital inpatients 18 years old and over. The updated rate for 2017 equates to approximately 2,550,000 HACs. The final 2017 HAC rate will be updated and recalculated in the future to take into account changes seen in seven of the HAC measures that use ICD-101 data these data will not be available until late 2019.
3 However, these measures are responsible for only 8 to 10 percent of the annual HACs measured for 2014 2017, so the final calculations are unlikely to make meaningful changes to the data. Based on the HAC reductions seen in 2015, 2016, and 2017 compared with 2014, AHRQ estimates a total of 910,000 fewer HACs occurred than if the 2014 rates had persisted through 2017. These HAC reductions lead to estimates of approximately $ billion in costs saved and approximately 20,500 HAC-related inpatient deaths averted from 2015 through 2017. Data reported in 2016 estimated that from 2011 through 2014, HAC reductions totaled million, and these reductions resulted in approximately $ billion in cost savings and 87,000 fewer HAC-related inpatient In the new and updated data for 2014 2017, not all types of HACs showed similar trends.
4 For example, measured adverse drug events continued to drop from 2014 to 2017, while measured pressure ulcers/pressure injuries increased from 2014 to 2015 and then decreased somewhat from 2015 to 2016 and 2017. A similar trend was seen for physician-diagnosed catheter - associated urinary tract infections . 1 ICD-10 = International Classification of Diseases, 10th Revision. The ninth revision is referred to as ICD-9. 2 See the AHRQ HAC report at AHRQ National Scorecard on Hospital-Acquired Conditions 2 Of special interest may be the apparent reduction in the rate of antibiotic- associated Clostridioides difficile3 infections . Comparing these data with other sources of information, such as the Centers for Disease Control and Prevention (CDC) and the AHRQ Healthcare Cost and Utilization Project (HCUP), may help us determine if efforts to reduce the occurrence of this important HAC are effective at the National level.
5 The new baseline of 99 HACs per 1,000 discharges was established and calculated for 2014 to monitor the progress of the Department of Health and Human Services (HHS) goal to reduce HACs by 20 percent from 2014 to 2019. This goal is specifically tied to the Centers for Medicare & Medicaid Services Hospital Improvement Innovation Networks, which work collaboratively with Federal and private partners to achieve this bold aim and build on prior successes. AHRQ estimates that if the 20 percent HAC reduction goal were achieved, the HAC rate in 2019 would be 79 per 1,000 discharges. That means approximately million fewer HACs would occur compared with the number that would have occurred if HAC rates for 2015 through 2019 had stayed the same as in 2014. If a 20 percent reduction were to occur in each type of HAC measured, AHRQ projects that these million fewer HACs would be associated with $ billion in cost savings and 53,000 fewer deaths from 2015 through 2019.
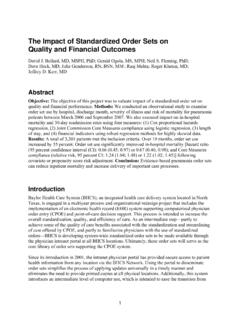
6 The results reported above through preliminary 2017 data are not inconsistent with achieving the 20 percent HAC reduction goal for 2019. Detailed Results The new 2014 baseline for the National HAC rate (NHR) is 99 HACs per 1,000 discharges. Exhibit 1 shows the details. Clostridioides difficile infections is italicized because it was added as a focus HAC for reduction efforts and tracking for 2014 through 2019. Clostridioides difficile infections were previously tracked in the All Other HACs measure, a collection of 13 other types of HACs. Methods used to calculate the NHR are provided in Appendix 1, and all the measures used in the NHR are shown in Appendix 2, Exhibit A2c. Exhibit 1. New 2014 National HAC rate baseline (rounded), updated January 2019 Hospital-Acquired Condition 2014 Measured Baseline for HACs 2014 Total HACs per 1,000 Discharges Adverse Drug Events 1,001,000 catheter - associated urinary tract infections 170,000 Central Line- associated Bloodstream infections 8500 Clostridioides difficile infections 86,000 Falls 239,000 Obstetric Adverse Events 67,000 Pressure Ulcers/Pressure Injuries 647,000 Surgical Site infections 73,000 3 Clostridium difficile has been changed to Clostridioides difficile.
7 More information is available at and AHRQ National Scorecard on Hospital-Acquired Conditions 3 Hospital-Acquired Condition 2014 Measured Baseline for HACs 2014 Total HACs per 1,000 Discharges Ventilator- associated Pneumonias 36,000 (Post-op) Venous Thromboembolisms 25,000 All Other HACs 584,000 Total 2,940,000 99 The new baseline established with the 2014 data was developed using a new method that was based on the method previously used to calculate the 2010-2014 The major difference between the new method and the previous method is that the new method includes patient charts for most Conditions treated in acute care hospitals. Previously, the Medicare Patient Safety Monitoring System (MPSMS) used patient charts from only four groups of patients. Three were represented by the principal diagnosis (acute myocardial infarction [AMI], congestive heart failure [CHF], and pneumonia [PN]).
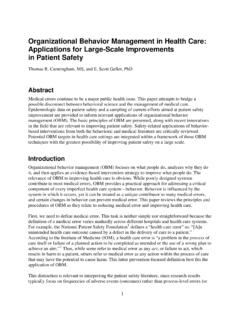
8 The other comprised major surgery patients, as described by the Surgical Care Improvement Project [SCIP]). These groups were used to calculate the 2010 2014 NHR. With the new method, charts for Conditions other than AMI, CHF, PN, and SCIP were sampled as a single group, starting with 2014, thus producing five sets of inpatient charts. The 2015 rate is 92 HACs per 1,000 discharges, and 2016 and preliminary 2017 rates are 88 and 86 HACs per 1,000 discharges, respectively (Exhibit 2). Also shown is the goal for 2019, 79 HACs per 1,000 discharges, which is a 20 percent reduction from the 2014 baseline NHR of 99. Detailed information on the number of HACs from 2015 to 2017 (preliminary) is shown in Appendix 2, Exhibit A2c. Appendix A2e shows how the current NHR, which starts in 2014 and will be tracked at least through 2019, compares with the NHR trended for 2010 to 2014.
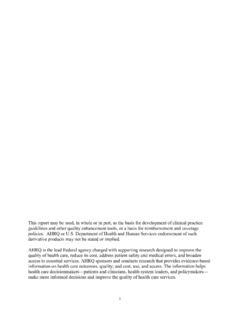
9 The 2010 to 2014 reduction was 17 percent over 4 years, and the 2014 to 2019 goal is a 20 percent reduction over 5 years. Appendix 3 shows the details of the HAC reductions, cost savings, and inpatient mortality reductions that are projected based on meeting this goal, which total million HACs, $ billion, and 53,000 lives. Appendix 4 describes changes in the samples used for the 2014 2017 analyses, compared with the 2010 2014 analyses. 4 See the report at AHRQ National Scorecard on Hospital-Acquired Conditions 4 Exhibit 2. Re-baselined 2014 data, with 2015, 2016, and preliminary 2017 National HAC rate data, and 2019 HAC goal Exhibit 3 provides the same information as Exhibit 2, but in table form that provides more details on the combined results to date, based on 2015 and 2016 data and preliminary data for 2017, compared with the 2014 baseline.
10 AHRQ National Scorecard on Hospital-Acquired Conditions 5 Exhibit 3. Re-baselined 2014 data, with 2015, 2016, and preliminary 2017 National HAC rate data, and percent change through preliminary 2017data Hospital-Acquired Condition 2014 Measured Baseline for HACs 2015 Normalized Count of HACs 2016 Normalized Count of HACs Preliminary 2017 Normalized Count of HACs Percent Change in HACs, 2014 vs. Preliminary 2017 2019 Goal (20% Reduction of each HAC) Adverse Drug Events -28% catheter - associated urinary tract infections -5% Central Line- associated Bloodstream infections -6% Clostridioides difficile infections -37% Falls -5% Obstetric Adverse Events -5% Pressure Ulcers/ Pressure Injuries 6% Surgical Site infections 0% Ventilator- associated Pneumonias -13% (Post-op) Venous Thromboembolisms -17% All Other HACs -12% Totals (rounded) 99 92 88 86 -13% 79 With the overall HAC reductions described above, and based on new per-HAC cost and mortality estimates updated in 2017 (see Appendix 5)