Transcription of AIR FRANCE-KLM RESULTS PRESENTATION
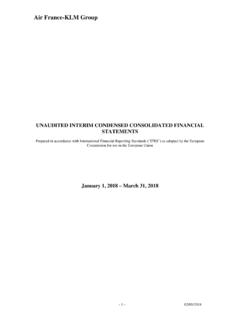
1 AIR FRANCE-KLM RESULTS PRESENTATION . Full Year 2018. 20 February 2019. RESILIENT FULL YEAR RESULT DESPITE STRIKE IMPACT AND FUEL. INCREASE. Passengers RASK(1). More than 100 million passengers carried in 2018, At constant currency + European leader for long-haul + Successful expansion of Transavia in France and the Netherlands and solid growth trend of MRO. third-party activity FY2017 FY2018 FY2017 FY2018. Significant progress in the social dialogue > Air France: finalization of labor agreements for all Operating result Net debt staff categories - 591m - 195m > KLM: new CLAs implemented for all staff 1,923 6,359 6,164. categories 1,332. (2) (2). FY2017 FY2018 FY2017 FY2018. (1) Group revenues per Available Seat Kilometer (RASK) Passenger + Transavia (2) Restated for implementation of new IFRS accounting standards 2.
2 FINANCIAL. REVIEW. FR D RIC GAGEY. RESULTS at 31 December 2018. Q4 2018: REVENUE INCREASE OF + AND AN OPERATING. RESULT AT 40 MILLION AFTER SIGNIFICANT FUEL IMPACT. (1). (1) Change Q4 2018 Q4 2017 Change at constant currency Revenues ( bn) + + EBITDA ( m) 776 970 Operating result ( m) 40 228 Operating margin pt pt (2). Net income - Group part ( m) -218 -928 +710m (1) Restated for implementation of new IFRS accounting standards (2) Net income - group part one-off elements in Q4 2017: - Positive effect of 47 million after tax in Q4 2017 resulting from IFRS 16 restatement of lease debt in dollars - Non current expense impact of 1,195 million after tax in Q4 2017 related to KLM pension plan de-recognition Excluding these one-offs, the change in Net income - group part Q4 2018 is -438 million compared to last year.
3 4. Q4 2018: REVENUE GROWTH SUPPORTED BY ALL BUSINESSES. Unit Revenues Operating result Capacity (1) Revenue (2) Change Change (3). Operating margin Change (3). Constant Currency ( m) ( m). + Network 5,727 + 34 pt + + Transavia + 309 + -42 + pt Maintenance 490 + 46 pt Group + 6,538 + 40 pt (1) Passenger airline capacity = Available Seat Kilometers, Cargo capacity = Available Ton Kilometers, Group capacity = Equivalent Available Seat Kilometers (2) Unit revenues: Passenger airlines = revenue per Available Seat Kilometer, Cargo = revenue per Available Ton Kilometer, Group = revenue per Equivalent Available Seat Kilometer (3) 2017 restated for implementation of the new IFRS accounting standards 5. Q4 2018: LONG-HAUL UNIT REVENUE SLIGHTLY POSITIVE WITH A STRONG.
4 ASIAN NETWORK PERFORMANCE, STABILITY IN THE MEDIUM-HAUL NETWORK. Total RASK ex cur. Premium Economy 1. + ASK RPK RASK ex cur. Medium-haul point-to-point Medium-haul hubs Total medium-haul 1. 1 1. ASK RPK RASK ex cur. ASK RPK RASK ex cur. ASK RPK RASK ex cur. North America Caribbean & Indian Ocean Asia 1. 1. 1. ASK RPK RASK ex cur. ASK RPK RASK ex cur. ASK RPK RASK ex cur. Latin America Africa & Middle East Total long-haul 1. 1 1. ASK RPK RASK ex cur. ASK RPK RASK ex cur. ASK RPK RASK ex cur. 6. Q4 2018 UNIT COSTS DOWN , FULL YEAR UNIT COSTS AT + IN LINE WITH GUIDANCE. Q4 2018 cost efficiencies offsetting wage inflation including retroactive booking Full Year 2018 unit cost + within guided target range, and net of strike impact Q4 2018 Underlying unit cost + + Reported (1) Currency effect Fuel price effect Pension effect At constant change currency, fuel and pension expenses (1) 2017 restated for implementation of the new IFRS accounting standards 7.
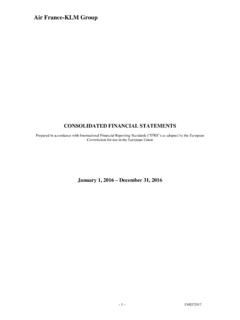
5 Q4 2018: LABOR PRODUCTIVITY IMPROVED, IMPLEMENTATION OF. ANNUAL WAGE AGREEMENTS AT AIR FRANCE. Q4 staff cost +3% and +1% excluding retroactive booking of the new Air France labor agreement Employee productivity + in Q4 (with capacity + ). Employee productivity Average FTEs, including temporary staff 51,600 52,450. +850 FTE +350 FTE. 31,950 + 32,350. + productivity(1) productivity(1). Q4 2017 Q4 2018 Q4 2017 Q4 2018. (1) Productivity measured in EASK/FTE. 8. FULL YEAR OPERATING RESULT AT BILLION, FURTHER NET DEBT. REDUCTION OF 195 MILLION. (1). Change FY 2018 FY 2017 Change at constant currency Revenues ( bn) + + EBITDA ( m) 4,217 4,763 Operating result ( m) 1,332 1,923 Operating margin pt pt Net income - Group part ( m) (2) 409 163 +151%. Adjusted operating free cash flow ( m) 115 677 ROCE pt (1).
6 (1). 31 Dec 2018 31 Dec 2017 Change Net debt ( m) 6,164 6,359 -195m Net debt/EBITDA + pt (1) Restated for implementation of new IFRS accounting standards (2) Net income - group part one-off elements in FY2017: - Positive effect of 386 million after tax in FY2017 resulting from IFRS 16 restatement of lease debt in dollars - Non current expense impact of 1,428 million after tax in 2017 related to KLM pension plan de-recognition Excluding these one-offs, the change of Net income - group part FY2018 is - 796 million compared to last year 9. RESILIENT RESULTS DESPITE STRIKE IMPACT AND FUEL INCREASE, SUBSTANTIAL MARGIN AT TRANSAVIA. Unit FY 2018 Capacity (1) Revenue (2). Revenues Change Operating result Change (3). Operating margin Change (3). Constant Currency ( m) ( m).
7 + + Network 22,943 + 994 pt + + Transavia + + 1,611 + 139 + + pt Maintenance 1,920 + 195 pt Group + + 26,515 + 1,332 pt (1) Passenger airline capacity = Available Seat Kilometers, Cargo capacity = Available Ton Kilometers, Group capacity = Equivalent Available Seat Kilometers (2) Unit revenues: Passenger airlines = revenue per Available Seat Kilometer, Cargo = revenue per Available Ton Kilometer, Group = revenue per Equivalent Available Seat Kilometer (3) 2017 restated for implementation of the new IFRS accounting standards 10. NETWORK REVENUE INCREASE DRIVEN BY HIGHER UNIT. REVENUES AND OPERATING RESULT IMPACTED BY STRIKES. Q4 2018 Passenger unit revenues at constant currency, including the negative impact of protest movements in France Full Year Passenger unit revenues at + at constant currency despite negative strike effect Ancillaries revenues at 650 million, + in 2018.
8 Compared to last year Q4 2018 Cargo maintains positive unit revenues (RATK) + at constant currency and Full Year 2018. at , particularly driven by strength in Asia, North America and Europe Both full freighters and bellies deliver an increased positive contribution to the Network result compared to last year 11. TRANSAVIA STRONG GROWTH AND A RECORD HIGH MARGIN. Best result since launch of Transavia: operating result of 139. million and operating margin above 8% in the two companies, of which Transavia France Accelerated capacity growth in fourth quarter 2018 + , ending 2018 with growth of + , of which +21% in France Transavia's cost structure is well aligned with the low-cost business model: Maximizing use of aircraft, a single aircraft type Simplicity of the product and fares, multiple options Light organizational structure, outsourcing non-core activities, strong synergies between the two subsidaries (2).
9 12. MAINTENANCE ORDER BOOK INCREASE CONTINUING. Several large contracts won for NextGen components and Engines Third-party revenues maintain solid growth trend, margin pressure partly due to one-offs For 2019, focus on margin through better optimization of the turn-around-time and first effects of selective tendering FY 2018 FY 2017 Change At constant In m currency Total revenues 4,349 4,155 + Third-party revenues 1,920 1,801 + + Operating result 195 252 -57 m -42 m (2). Operating margin pt pt In $m 31 Dec 2018 31 Dec 2017 Change Order book (1) 11,400 10,800 +600 m (1) Order book is the cumulative value of signed contracts with external customers and may differ from the order book accounting definition in the financial statements 13. AIR FRANCE RESULT IMPACTED BY STRIKES, KLM DELIVERS A SOLID.
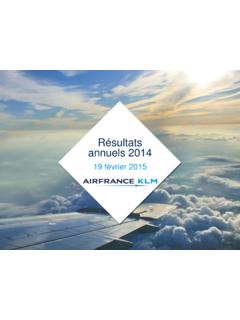
10 RESULT IN LINE WITH LAST YEAR'S PERFORMANCE. FY 2018. Operating Revenues Operating Net debt Capacity Change result Change Change Change ( m) margin ( m). ( m). + 16,073 + 266 pt 3,556 -36. + 10,955 + 1,073 pt 2,826 -454. + 26,515 + 1,332 pt 6,164 -195. 2017 restated for implementation of the new IFRS accounting standards 14. POSITIVE ADJUSTED OPERATING FREE CASH FLOW DESPITE THE. STRIKES. FY 2018. In m (FY 2017: +291) (FY 2017: -141) (FY 2017: -2438). (FY 2017: +3949) +246 -130 -2,625. 3,596. (FY 2017: +1661) (FY 2017: -984). 1,087 -972. (FY 2017: 677). 115. (1). Cash flow before VDP Change in WCR Voluntary Departure Net investments Operating Free Cash Payment of lease debt Adjusted operating free and change in WCR Plans Flow cash flow (1) Adjusted operating free cash flow = Operating free cash flow with deduction of repayment of lease debt 15.