Transcription of Air Freight Market Analysis - iata.org
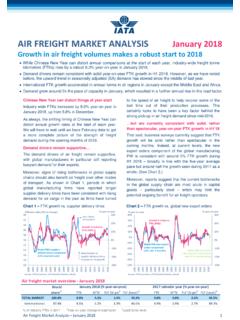
1 Air Freight Market Analysis January 2018 1 Air Freight Market overview - January 2018 FTK1 AFTK1 FLF (%-pt)2 FLF (l evel )3 FTK1 AFTK1 FLF (%-pt)2 FLF (l evel )3 TOTAL I nte rna ti ona of industry FTKs in 20172 Year-on-year change in load f actor3 Load f actor levelWorld share1 January 2018 (% year-on-year)2017 calendar year (% year-on-year) AIR Freight Market Analysis January 2018 Growth in air Freight volumes makes a robust start to 2018 While Chinese New Year can distort annual comparisons at the start of each year, industry-wide Freight tonne kilometres (FTKs) rose by a robust year-on-year in January 2018. Demand drivers remain consistent with solid year-on-year FTK growth in H1 2018. However, as we have noted before, the upward trend in seasonally adjusted (SA) demand has slowed since the middle of last year. International FTK growth accelerated in annual terms in all regions in January except the Middle East and Africa.
2 Demand grew around 2x the pace of capacity in January, which resulted in a further annual rise in the load factor. Chinese New Year can distort things at year-start Industry-wide FTKs increased by year-on-year in January 2018, up from in December. As always, the shifting timing of Chinese New Year can distort annual growth rates at the start of each year. We will have to wait until we have February data to get a more complete picture of the strength of Freight demand during the opening months of 2018. Demand drivers remain The demand drivers of air Freight remain supportive, with global manufacturers in particular still reporting buoyant demand for their exports. Moreover, signs of rising bottlenecks in global supply chains should also benefit air Freight over other modes of transport. As shown in Chart 1, periods in which global manufacturing firms have reported longer supplier delivery times have been consistent with rising demand for air cargo in the past as firms have turned to the speed of air Freight to help recover some of the lost time out of their production processes.
3 This certainly looks to have been a key factor behind the strong pick-up in air Freight demand since mid-2016..but are currently consistent with solid, rather than spectacular, year-on-year FTK growth in H1 18 That said, business surveys currently suggest that FTK growth will be solid rather than spectacular in the coming months. Indeed, at current levels, the new export orders component of the global manufacturing PMI is consistent with around 5% FTK growth during H1 2018 broadly in line with the five-year average pace but around half the growth seen during 2017 as a whole. (See Chart 2.) Moreover, reports suggest that the current bottlenecks in the global supply chain are most acute in capital goods particularly steel which may limit the potential ongoing benefit for air Freight operators. Chart 1 FTK growth vs. supplier delivery times Chart 2 FTK growth vs.
4 Global new export orders -30%-20%-10%0%10%20%30%40424446485052545 6586020002001200220032004200520062007200 8200920102011201220132014201520162017201 8 Diffusionindex (50=no change)% year-on-yearGrowth in industry FTKs(RHS)Global PMI suppliers' delivery times component (LHS, inverted scale)Sources: iata Economics, iata Monthly Statistics, Markit2011 T hoku earthquake in Deterioration in supplier delivery times, increase in FTKgrowth-30%-20%-10%0%10%20%30%-50%-40% -30%-20%-10%0%10%20%30%40%20002001200220 0320042005200620072008200920102011201220 1320142015201620172018% year-on-year% year-on-yearGrowth in industry FTKs(RHS)Global PMI new export orderscomponent (LHS, adv. 2 months)Sources: iata Economics, iata Monthly Statistics, MarkitImpliedPMI series if the index remains flat at its latest value in the months ahead Air Freight Market Analysis January 2018 2 Upward trend in SA volumes has slowed In any case, it is important to note that the robust year-on-year FTK growth rates seen in January and late-2017 stem mainly from the upward trend in SA volumes seen in the first 8 months of last year; indeed, as we have noted before, this upward trend has slowed markedly over the past five months or so, with volumes currently trending upwards at an annualized pace of around 4-5%.
5 (See Chart 3.) Chart 3 FTK levels All told, we expect industry-wide FTKs to grow by around in 2018 as a whole. After the very strong growth performance seen in 2017 this would still be a robust outcome. That said, the possibility of a global trade war following the recent imposition of tariffs on steel and aluminium products by the US poses obvious downside risks to broader global trade. We will continue to monitor developments particularly the implications for air Freight over the coming months. Cargo demand grew 2x faster than capacity in Jan. Available Freight tonne kilometres (AFTKs) grew by year-on-year in January 2018 just over half the corresponding pace of demand. As a result, the industry-wide load factor rose by percentage points compared to January 2017. Chart 4 International FTK growth International FTK growth rose in all regions in 2017 International FTKs grew by year-on-year in January 2018, up from in January 2017.
6 (See Chart 4.) Year-on-year growth in international FTKs accelerated in annual terms in all regions in January except the Middle East and Africa. Africa tops the international growth chart Despite slowing, African airlines still topped the international FTK growth chart in January for the 16th time in 17 months, with year-on-year growth of As we have noted before, African airlines Freight volumes have been boosted by a strong upward trend in traffic between Africa and Asia. FTKs flown on this segment grew by 59% year-on-year in 2017, following an increase in the number of direct services between the two continents on the back of ongoing foreign investment flows into Africa from Asia. (See Chart 5.) Chart 5 International FTK growth by route (% year-to-date, calendar-year 2017) ..followed by airlines based in Europe European airlines were the only other region to post double-digit annual international FTK growth in January ( year-on-year).
7 The upward trend in international volumes flown by European airlines slowed during the second half of last year, to an annualized pace of around 2-3%. However, Freight volumes jumped by 3% in SA month-on-month terms in January the largest month-on-month increase since March 2017. We will continue to monitor whether this is a one-off or the start of a new upward leg in demand. Certainly, manufacturers in the region are still reporting very healthy demand for their exports, although the new export orders component of the regional PMI has slipped from 18-year highs in recent months. (See Chart 6, overleaf.) A pause in Asia Pacific SA Freight International FTKs flown by airlines based in Asia Pacific grew by year-on-year in January, up from in December. Manufacturers in the key exporting 1314151617181920212220142015201620172018 Industry FTKs (billion per month)ActualSeasonally adjustedSources: iata Economics, iata Monthly 2018 Dec 2017 International Freight tonne kilometres (% year-on-year)IndustryAfricaEuropeN.
8 AmericaL. AmericaAsia PacificMiddle EastSources: iata Economics, iata Monthly StatisticsAfrica -AsiaAfrica -Middle EastEurope -AsiaEurope -Middle EastEurope -North AmericaAsia -North AmericaMiddle East -AsiaMiddle East -North AmericaNorth -Central AmericaNorth -South AmericaAmericas -SW PacificWithin EuropeWithin AsiaWithin South America-10%0%10%20%30%40%50%60%0%2%4%6%8 %10%12%14%16%18%20%22%Share of total international FTKs (%, Year-ended Dec 2017)Sources: iata Economics, iata Monthly Statistics by RouteInternational FTK growth by route (% year-on-year, calendar year 2017) Air Freight Market Analysis January 2018 3 countries of China and Japan are continuing to report strong demand for their exports, in part reflecting the recent pick-up in economic activity and import demand in Europe. (Again, see Chart 6.) Chart 6 Selected new export orders components of manufacturing PMI indices That said, the current strength in the year-on-year growth rate for Asia Pacific airlines mainly reflects strong SA gains seen in early-2017.
9 The upward trend has since paused, with Freight volumes currently broadly in line with where they were in May 2017. Given the importance of airlines based in Asia Pacific to the overall air Freight industry, we will continue to monitor developments in the SA trend closely over the coming months..and a similar picture for North American airlines It is a broadly similar picture for North American airlines too. While international FTKs grew by year-on-year in January 2018, volumes in SA terms are less than 1% higher than where they were in August 2017. The comparative strength of the US economy and dollar between 2014 and 2017 helped to support inbound air Freight volumes to the US. The weakening seen in the US dollar over the past year or so is likely to reduce this pillar of support, although this may be offset in part by any potential boost to activity and demand from the recently agreed tax package.
10 Robust FTK growth for Latin America carriers Year-on-year growth in international FTKs flown by airlines based in Latin America accelerated to a four-month high in January ( , up from in December). The upward trend in SA FTK volumes has paused in recent months, although the bigger picture is that volumes have recovered strongly over the past 18 months or so since reaching a trough in May 2016. This turnaround has been helped by a recovery in the continent s largest economy, Brazil. FTKs in SA terms are currently broadly in line with where they were in late-2014. Middle East carriers post slowest regional growth Airlines based in the Middle East posted the slowest international FTK growth rate in January for just the third time in the past decade ( year-on-year). While Freight volumes are continuing to trend upwards in SA terms, the trend has slowed over the past four months or so.
