Transcription of Air Passenger Market Analysis - iata.org
1 Air Passenger Market Analysis February 2018 1 Air Passenger Market overview - February 2018 RPK1 ASK1 PLF (%-pt)2 PLF (l evel )3 RPK1 ASK1 PLF (%-pt)2 PLF (l evel )3 TOTAL I nte rna ti ona Dome s ti of industry RPKs in 20172 Year-on-year change in load f actor3 Load f actor levelFebruary 2018 (% year-on-year)% year-to-dateWorld share1 AIR Passenger Market Analysis February 2018 Passenger growth rebounds in Feb after Lunar New Year distortion As expected, year-on-year growth in industry-wide revenue Passenger kilometres (RPKs) rebounded in February following the distortion last month from temporary factors including the later timing of Lunar New Year in 2018.
2 The upward trend in Passenger volumes is continuing to be supported by robust global economic conditions. The industry-wide load factor posted a record high for the month of Feb ( ). All regions except the Middle East posted record highs for the month, while the domestic India load factor exceeded 90% for the first time ever. Carriers based in Latin America posted the fastest international RPK growth of all regions in February. Meanwhile, year-on-year growth in domestic India RPKs remained in double-digit territory for the 42nd month in a row. RPK growth rebounded in February as As expected, year-on-year growth in air Passenger volumes rebounded in February following the distortion last month owing to the later timing of Lunar New Year this year.
3 Industry-wide revenue Passenger kilometres (RPKs) increased by year-on-year compared to February 2017, up from in January..although the strong demand trend seen a year ago is affecting the annual comparison Overall, global RPKs grew by in year-on-year terms over the first two months of 2018 combined the slowest annual growth over this period in five years. However, it is important to note that year-to-date RPK growth so far in 2018 has been affected by the comparison with the very strong upward trend in seasonally adjusted (SA) Passenger traffic in early-2017. We estimate that this has reduced the annual growth rate so far this year to date by around percentage points relative to where it would have been had the SA traffic trend not been so strong a year ago.
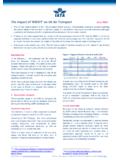
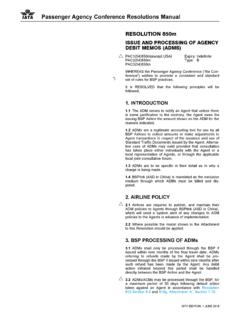
4 In any case, the key point is that global Passenger volumes have continued to trend upwards solidly in recent months, with Passenger volumes currently rising at a annualized rate. (See Chart 1.) To put this into context, while this is slower than the full-year pace of growth seen in 2017 ( ) it is still well ahead of the ten-year average rate ( ). Robust economic backdrop is supporting demand Passenger demand is continuing to be supported by the robust global economic backdrop. The composite Chart 1 Air Passenger volumes Chart 2 Air Passenger volume growth and global composite business confidence measure 4004505005506006507007502014201520162017 2018 Industry RPKs (billion per month)ActualSeasonally adjustedSources: iata Economics, iata Monthly Statistics-12%-8%-4%0%4%8%12%16%30354045 5055606520072008200920102011201220132014 2015201620172018 Diffusionindices% year-on-yearGrowth in industry RPKs (RHS)Global composite PMI index (adv.)
5 2 months, LHS)Sources: iata Economics, iata Monthly Statistics, Markit Air Passenger Market Analysis February 2018 2 Purchasing Managers Index (PMI) a measure of global business confidence that has proved to be a useful leading indicator of air Passenger demand growth in the past recently rose to its highest level in three and a half years. It is currently at a level that is usually consistent with year-on-year RPK growth in the region of 8%. (See Chart 2, previous page.) As shown in Chart 3, the strength remains broad-based across most of the world s major economies. Chart 3 Economic conditions (monthly data from composite PMIs, selected regions and countries) As have we noted before, we think that RPK growth is unlikely to achieve the sort of pace in 2018 that the PMI suggests.
6 This is mainly because increases in airline input costs notably fuel prices but also labor costs in some countries mean that we expect to see a reduced boost to demand from lower airfares in 2018 than we have in recent years. Nonetheless, we still expect 2018 to be another year of above-trend growth for industry-wide RPKs, albeit slightly slower than that seen in 2017. Capacity and RPKs are trending up at similar rates Industry-wide available seat kilometres (ASKs) increased by year-on-year in February. As a result, the Passenger load factor increased by percentage points compared to the same period in 2017, taking it to a record high for the month of February.
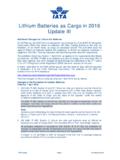
7 That said, ASKs and RPKs have both trended upwards in SA terms at a similar pace in recent months. International RPK growth slowed in most regions Annual growth in international RPKs accelerated to in February, up from the 46-month low of in January. (See Chart 4.) Year-on-year growth accelerated in all regions compared to January. carriers top the growth chart again Latin American airlines posted the fastest year-on-year international RPK growth rate for the second month in a row in February ( ), up from The upward trend in SA Passenger volumes weakened during the third quarter of last year owing to disruption caused by the harsh hurricane season.
8 However, SA RPK volumes have continued to increase at a double-digit annualized rate in recent months. Chart 4 International Passenger traffic growth by airline region of registration Robust growth in the biggest regions European airlines flew more international RPKs in February than they did a year ago a modest acceleration from that seen in January. Passenger volumes are currently trending upwards at a double-digit annualized rate alongside ongoing supportive economic conditions in the region. Meanwhile, year-on-year RPK growth for airlines based in the Asia Pacific region rebounded sharply in February as distortion from the later Lunar New Year eased; annual RPK growth more than doubled to from in January.
9 Passenger traffic is continuing to be supported by robust regional economic growth and ongoing expansion in the number of options for travelers. N. American traffic is rising in SA terms again North American RPKs appear to have now broken out of their recent sideways trend; international RPK growth accelerated to an 11-month high in February ( ). The comparatively robust economic backdrop in the US is continuing to support outbound Passenger demand from the region, while the weaker US dollar appears to be helping to offset some of the negative impacts that we have seen on inbound travel. Middle East growth to find support during H1 2018 Year-on-year growth in international RPKs flown by airlines based in the Middle East accelerated to in February, up from in the previous month (which was its slowest pace since September 2008).
10 Traffic is currently trending upwards at a moderate annualized pace. 2018 Jan 2018 International revenue Passenger kilometres (% year-on-year)IndustryL. AmericaAsia PacificN. AmericaEuropeAfricaMiddle EastSources: iata Economics, iata Monthly Statistics Air Passenger Market Analysis February 2018 3 The region s airlines saw a declining trend in Passenger traffic during H1 2017 in the face of numerous headwinds, including the now-lifted ban on personal electronic devices, as well as a wider impact stemming from the proposed travel bans to the US. As a result, even if traffic continues to trend upwards at its current moderate pace, year-on-year RPK growth is likely to accelerate further in the coming months (to >6% in the middle of the year).