Transcription of Air Pollution and Health - TERI: Innovative Solutions for ...
1 Air Pollution and Health Discussion Paper One of the main outcomes of the United Nations Conference on Sustainable Development (Rio+20) was the agreement by Member States to launch a process to develop a set of Sustainable Development Goals (SDGs). The goal 3 Ensure healthy lives and promote well-being for all at all ages aims at securing a healthy life for all. Measures to achieve this goal involves substantially reducing the number of deaths and illnesses from hazardous chemicals and air, water, and soil Pollution and contamination. This paper discusses the Health impacts arising from ambient and household air Pollution globally and at the national level (India) and recommends policy measures to reduce the Health impact from air Pollution in the national context. The Energy and Resources Institute (TERI) Disclaimer All rights reserved.
2 Any part of this publication may be quoted, copied, or translated by indicating the source. The analysis and policy recommendations of the book do not necessarily reflect the views of the funding organizations or entities associated with them. Suggested Citation TERI. 2015. Air Pollution and Health . Discussion Paper by The Energy and Resources Institute: New Delhi. Authors Rinki Jain (Associate Fellow, TERI) Karnika Palwa (Research Associate, TERI) Reviewer Meena Sehgal (Fellow, TERI) Sumit Sharma (Fellow, TERI) Shailly Kedia (Fellow, TERI) The discussion paper is an output of a project on energy and environment goals under DFID-TERI Partnership for Clean Energy Access and Improved Policies for Sustainable Development. This paper will also be available as a chapter in TERI Energy & Environment Data Diary and Yearbook (TEDDY) 2016. 1 Introduction Clean air is the foremost requirement to sustain healthy lives of humankind and those of the supporting ecosystems which in return affect the human wellbeing.
3 Release of various gaseous emissions and particulate matter (PM) has been on the rise due to rampant industrialized growth Anthropogenic emissions of various kinds are being pumped into the atmosphere (called primary pollutants) and lead to the formation of new pollutants due to chemical reactions in the atmosphere (called secondary pollutants). These are building up the concern of ambient air Pollution (AAP) as a prominent global threat to human Health in many ways. For instance, according to the Fifth Assessment Report of the IPCC nearly all the non-CO2 climate-altering pollutants are Health damaging, either directly or by contributing to secondary pollutants in the atmosphere . The UN General Assembly's Open Working Group (OWG) on Sustainable Development Goals forwarded to the Assembly its proposal for a set of goals that consider economic, social and environmental dimensions to improve people s lives and protect the planet for future generations at the conclusion of the Group s thirteenth and final session at UN Headquarters on 19 July 2014.
4 The proposal contains 17 goals with 169 targets covering a broad range of sustainable development issues, including ending poverty and hunger, improving Health and education, making cities more sustainable, combating climate change, and protecting oceans and forests. The goal 3 Ensure healthy lives and promote well-being for all at all ages aims at securing a healthy life for all. There are 9 sub-goals to this goal and sub-goal targets to substantially reduce the number of deaths and illnesses from hazardous chemicals and air, water, and soil Pollution and contamination by 2030. It is essential that the hazardous impacts from environmental Pollution are regularly reported and monitored. Of the various kinds of Pollution , the air Pollution has attracted high priority in respect of environmental regulation since the environmental damage due to such Pollution mostly affects human well-being directly by way of adverse Health effects on the population exposed to it.
5 Air quality has deteriorated in most large cities in India, a situation driven by population growth, industrialization and increased vehicle use. Integrated air quality management (AQM), which is an evaluation and monitoring tool, is a challenge to carry out in most developing countries because of the lack of information on sources of air Pollution and insufficient ambient air monitoring data that is available in the public domain (TERI 2009). Urban air Pollution is largely a result of combustion of fossil fuels that are used in transportation, power generation, industrial sector, and other economic activities. Household air Pollution (HAP), also known as indoor air Pollution (IAP), is a serious area of concern in rural spaces, as majority of this population continues to depend on traditional biomass for cooking and space heating and depend on kerosene or other liquid fuels for lighting, all of which are highly likely to lead to high levels of HAP.
6 More than 70% of the population in India depends on traditional fuels (firewood, crop residue, cow dung, coal and lignite) for cooking and almost 32% depend on kerosene for lighting purposes. About 3 billion people in the world (more than 40% of the global population) rely on traditional biomass for the purpose of cooking and an estimated 500 million households rely on kerosene and similar for the purpose of lighting (WHO, 2015). In rural India, for instance, only of the households use LPG for cooking (Census 2011). This chapter discusses the Health impacts arising from ambient and household air Pollution and recommends policy measures to reduce the Health impact from air Pollution . The focus of the paper is 2 on the global burden of air Pollution and recommendations to reduce air Pollution in the national context.
7 Parameters of air quality Air Pollution consists of a complex mix of various substances in different physical and chemical states and these arise from various sources. Many of them are believed to be gravely harmful to human Health . Eminent international institutions like the World Health Organisation (WHO) consider a certain set of air Pollution indicators to get closer to quantification and monitoring of air Pollution as quantification of all the air pollutants has not yet been feasible on a global scale. WHO focuses on four Health -related air pollutants, namely, particulate matter (PM), measured as particles with an aerodynamic diameter lesser than 10 m (PM10) and lesser than m ( ), nitrogen dioxide, sulfur dioxide and ozone. The focus on just these four is for the sake of monitoring the general state of air quality and it does not mean that the other air pollutants do not impact Health of humans and that of the environment (WHO, 2006).
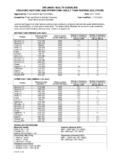
8 Figure 1 and Figure 2 give the annual mean concentration of PM10 and in different regions of the world respectively. For both the figures, the data represented belongs to years in the period 2008-2012 since this data is available for different years for the different stations. The highest and the lowest recorded values of PM10 and for each region are represented in these two figures. The WHO guideline values for particulate matter are 20 g/m3 for PM10, 10 g/m3 for , 40 g/m3 for NO2 and 20 g/m3 for SO2 . The orange line denotes the WHO limits. The red dots plotted over each country s bar graph in both the figures represent the HDI value for that country as reported in the year 2012. Figure 1: Annual mean concentration of PM10 (ug/m3) in regions of the world1 Note: Yellow bar denotes lowest value for the region and blue bar denotes highest value for the region.
9 These are based on data for a particular region and are not average values for a region. The orange line denotes the permissible limit of 20 g/m3 The red dots depict the HDI value Source: Ambient Air Pollution Database, WHO (2014) 1 AFR (Africa), AMR (America), AMR (America), EMR (Eastern Mediterranean Region), SEAR (South-East Asia Region), WPR (Western Pacific Region), HI (High-Income), LMI (Low and Middle Income) City/station at the specific countries whose data is presented: Mauritius (Midlands), Senegal (Dakar), Brazil (Salvador), Mexico (Mexico City), USA (Lake Havasu City-Kingman, Arizona), Chile (Rancagya), Lebanon (Beirut), Pakistan (Peshawar), Oman (Muscat), Bahrain (Hamad Town), Romania (Galati), Turkey (Igdir), Iceland (Hafnarfjordur), Israel (Ashkelon), Maldives (Male-Friday Mosque Station), India (Gwalior), Malaysia (Tanah Rata), Mongolia (Darkhan), Australia (Illawarra), Republic of Korea (Cheongju) 20 179 17 93 6 79 63 540 82 318 18 135 9 74 20 329 15 174 8 66 of KoreaAFRAMR LMIAMR HIEMR LMIEMR HIEuropeLMIE urope HISEARWPR LMIWPR HI g/m3 HDI 3 Figure 2: Annual mean concentration of (ug/m3) in regions of the world2 Note: Yellow bar denotes lowest value for the region and blue bar denotes highest value for the are based on data for a particular region and are not average values for a region.
10 The orange line denotes the permissible limit of 30 g/m3. The red dots depict the HDI value Source: Ambient Air Pollution Database, WHO (2014) In Figure 1, for PM10, the highest recorded level is in EMR LMI, where the value recorded comes from a station (Peshawar) in Pakistan. The lowest recorded level is in WPR HI, where the value recorded comes from a station (Illawarra) in Australia. In Figure 2, for , the highest recorded level is in SEAR, where the value recorded comes from a station (Delhi) in India. The lowest recorded level is in AMR HI, where the value recorded comes from a station (Powell River) in Canada. Generally, the high income group countries have lesser PM10 and values than the low income group countries except in the case of concentration in Chile. The highest value of in AMR HI (in Chile) is greater than the highest value in AMR LMI (in Brazil). Overall, the EMR and SEAR are faring the worst in terms of PM10 and amongst other regions of the world.