Transcription of Airline ancillary revenue projected to be $59.2 …
1 Page 1 of 5 Airline ancillary revenue projected to be $ billion worldwide in 2015 The CarTrawler worldwide estimate of ancillary revenue forecasts increase above 2014, with $ billion of the total composed of a la carte fee activity. Dublin, Ireland & Shorewood, Wisconsin, 9 November, 2015: IdeaWorksCompany, the foremost consultancy on Airline ancillary revenues, and CarTrawler, the leading provider of online car rental distribution systems, project Airline ancillary revenue will reach $ billion worldwide in 2015. The CarTrawler Worldwide Estimate of ancillary revenue represents a giant increase of 163% from the 2010 figure of $ billion, which was the first year for the ancillary revenue estimate.
2 Earlier this year, CarTrawler and IdeaWorksCompany reported the ancillary revenue disclosed by 63 airlines for 2014. These statistics were applied to a larger list of 180 airlines to provide a truly global projection of ancillary revenue activity by the world s airlines in 2015. The CarTrawler Worldwide Estimate of ancillary revenue marks the sixth year IdeaWorksCompany has prepared a projection of global ancillary revenue activity. ancillary revenue is generated by activities and services that yield revenue for airlines beyond the simple transportation of customers from A to B. This wide range of activities includes: commissions gained from hotel bookings, the sale of frequent flier miles to partners and the provision of a la carte services providing more options for consumers and more profit for airlines .
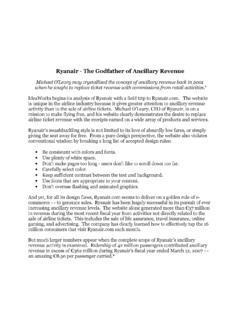
3 revenue from optional services, such as onboard sales of food and beverages, checked baggage, premium seat assignments, and early boarding benefits, was determined to represent $ billion of the projected global 2015 total. The smaller share, at $ billion, comes from non-fee activity such as the sale of frequent flier miles to program partners, and commissions earned on the sale of services to travelers, such as hotel accommodations and car rentals. Worldwide Estimate of ancillary revenue 2015 Estimate $ billion ( of global revenue of $763 billion) 2014 Estimate $ billion ( of global revenue of $746 billion) 2013 Estimate $ billion (6% of global revenue of $708 billion) 2012 Estimate $ billion ( of global revenue of $667 billion) 2011 Estimate $ billion ( of global revenue of $577 billion) 2010 Estimate $ billion ( of global revenue of $474 billion) Source.
4 ancillary revenue statistics applied by IdeaWorksCompany to individual Airline revenue results for the year indicated from Air Transport World, Airline Business, and at Airline websites. These figures show the impact that ancillary revenue has on the bottom lines of airlines , but it is also a critically important element of the customer experience, says Michael Cunningham, Chief Commercial Officer at CarTrawler. airlines that offer a rounded, sophisticated customer experience by drawing on data science insights and the right ancillary offerings have a better chance of backing up revenues with increased loyalty and a stronger brand promise, which in turn leads to increased repeat bookings.
5 Page 2 of 5 Analysis performed by IdeaWorksCompany during the past six years reveals natural groupings (or categories) based upon a carrier s ability to generate ancillary revenue . The percentage of revenue results associated with four defined categories have been applied to a worldwide compilation of operating revenue disclosed by 180 The following describes the four categories: Traditional airlines . This category represents a catch-all for the largest number of carriers. ancillary revenue activity may consist of fees associated with excess or heavy bags, extra legroom seating and partner activity for a frequent flier program.
6 The average percentage of revenue increased to from last year. Examples in this category include Air China, Avianca, Etihad Airways, and SWISS. Major US airlines . US-based majors generate strong ancillary revenue through a combination of frequent flier revenue and baggage fees. The percentage of revenue for this group jumped to from for 2014 due to better revenue management and agency distribution, and more financial disclosures. Examples include Alaska, Delta, and United. ancillary revenue Champs. These carriers generate the highest activity as a percentage of operating revenue . The percentage of revenue achieved by this group grew to from for 2014.
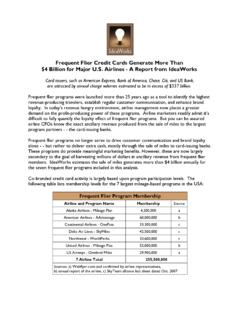
7 Examples include Spirit airlines , Tigerair, and Wizz Air. Low Cost Carriers. LCCs throughout the world typically rely upon a mix of a la carte activity to generate good levels of ancillary revenue . The percentage of revenue for this group was , which is slightly below last year s The percentage dropped because a few better performing airlines were reclassified under the Champs category this year. Low cost carriers include Icelandair, Jazeera Airways, Jeju Air, and Spring airlines . CarTrawler Worldwide Estimate of ancillary revenue by Carrier Type for 2015 Airline Category Total ancillary revenue Frequent Flier & Commission Based A la Carte Activity Traditional airlines $ billion $ billion $ billion US Major airlines $ billion $ billion $ billion ancillary revenue Champs $ billion $ billion $ billion Low Cost Carriers $ billion $ billion $ billion Worldwide Totals $ billion $ billion $ billion Source.
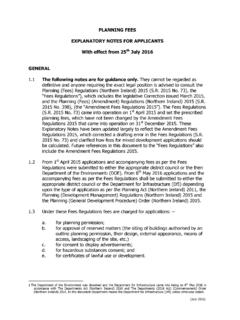
8 ancillary revenue statistics applied by IdeaWorksCompany to individual Airline revenue results for the year indicated from Air Transport World, Airline Business, and at Airline websites. The US Major airlines category produces a significant share of global ancillary revenue (see Graph 1). The $ billion result ( of the global total) is generated by just six carriers: Alaska airlines , American, Delta, Hawaiian, Southwest, and United. These carriers rely upon their frequent flier programs to generate a significant share of ancillary revenue . For example, more than 62% of Delta s ancillary revenue is produced by its SkyMiles frequent flier program.
9 The largest category at is generated by carriers classified as Traditional airlines . This group consists of 109 carriers out of the total 180 Airline sample. 1 Operating revenue results were drawn from the World Airline Report published in the July 2015 issue of Air Transport World and the World Airline Rankings in the July-August 2015 issue of Airline Business. Additional sources were used, such as disclosures made at Airline websites, to complete the list of 180 airlines . Adjustments were made to prevent duplicate reporting associated with regional affiliates.
10 Pure cargo carriers, such as FedEx and UPS airlines , were not included. airlines are assigned to specific categories each year based upon an assessment of a carrier s ancillary revenue profile. Page 3 of 5 Graph 2 displays the typical ancillary revenue sources for carriers such as American, Delta, and United. Baggage fees for US carriers represent approximately 20% of their ancillary receipts. The remaining revenue is produced by an array of a la carte and commission-based products. Other sources include onboard sales of food, beverages, Wifi, and commissions from car rental bookings.