Transcription of All the graphs and formulas you need for AP Macroeconomics
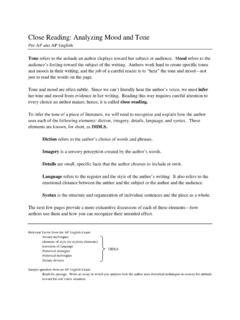
1 All the graphs and formulas you need for AP Macroeconomics Aggregate Demand/Aggregate Supply with Long Run Aggregate Supply PL is price level, a representation of the inflation rate. LRAS is the long run aggregate supply curve, a representation of the economy s full employment output. AS is the short run aggregate supply curve, representing the short term production. This curve is affected by resource cost, actions of the government and productivity. Bottom line: things that are good for business will shift AS to right, bad things shift it left.
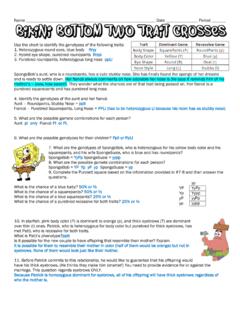
2 AD is the aggregate demand curve, a representation of what Consumers, Businesses, the Government and foreigners are demanding (CigGXn). These factors will shift the curve left and right by decreasing and increasing. RGDP is real gross domestic product, the amount of output that is being produced and demanded. It is synonymous with income (Y) and employment. Short run and long run Phillips Curve The Short run Phillips curve represents the trade off between inflation and unemployment in the short run. The long run Phillips curve shows no relationship between unemployment and inflation.
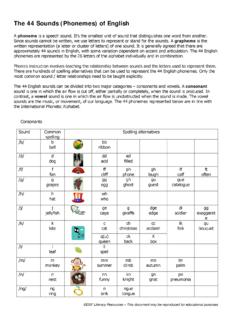
3 In the long run the economy always moves to full employment. You should always draw this curve with the AD/AS curve next to it so that you can use the mirror image that the AS curve represents to the Phillips Curve. That means that whatever shifts the AS curve will shift the PC curve the opposite direction. Also, when the AD curve shifts, it creates a new AQS which also means a new point on the SRPC. What will shift the PPC will shift the LRAS will shift the LRPC. Production Possibilities Curves PPC represents several economic concepts. The PPC shows the trade-off that exists when production choices are made.
4 Scarcity: is represented by the frontier line that shows that a limited quantity of goods and/or services can be produced with limited resources. Opportunity cost is represented by the different points along the curve. Moving from point to another requires that you give up some of one good in order to have more of another. Unemployment is represented by points within the curve. Points outside the curve are unattainable without new resources or technology. Economic growth is represented by an outward shift of the curve. The straight line, constant slope, illustrates constant costs.
5 The curved line, convex, illustrates increasing costs. Foreign Exchange Markets for Currency: The FOREX graph illustrates the changes in values of currencies that result from shifts in Supply or Demand for the currencies. The demand for a currency fluctuates based on factors including the nation s price level, interest rates, and income. If a nation s price level increases relative to another nation s then that nation s goods will be in less demand (nobody wants to pay higher prices). If the nation s goods are in less demand, so will their currency be.
6 If a nation s interest rates are higher relative to another, then that nation s currency will be in higher demand for financial investors interested in placing financial assets in banks earning higher interest. If a nation s income is higher than other nation s, then that nation s citizens will be purchasing more of other nation s goods which would increase the demand for the lower income nation s currency and increase supply of the higher income nation s currency. When a currency costs more (either decrease in supply or increase in demand), it s exports will decrease because they have become relatively more expensive.
7 The currency has appreciated. When a currency costs less, depreciates (either increase in supply or decrease in demand) it s exports will increase because they become relatively less expensive. When the demand of one currency increases, the supply of the other currency also increases. In answering questions regarding FOREX and exports, always take things one step at a time. For example, if a nation s price level is higher, then people will not be buying its exports and its currency will be in lower demand. Then, the depreciated currency will cause their exports to become less expensive and their exports will increase.
8 It s like a pendulum swinging back and forth. Always answer questions based on the immediate effects. Loanable Funds Market: The loanable funds market is the market where funds are obtained for borrowing (demand for LF) or where funds are placed for saving (supply of LF). Think of the LFM as a bank where people visit for two reasons: to borrow money and to save money. The price paid for loanable funds is the real interest rate (nominal rate minus inflation) The supply of loanable funds is made up of people, businesses, and foreigners that all have money in the bank earning interest.
9 If savings increases then the S of LF will increase (shifts right). If savings decreases, then the S of LF will shift left. Note the changes that occur in the real interest rate. The demand for loanable funds is made up of people, businesses, foreigners and the government who want to borrow money. If borrowing is increased, then the demand for LF will shift to the right. If borrowing is decreased, then the demand for LF will shift left. Note the change in the real interest rate . This is the graph that you will need to draw when discussing real interest rates.
10 Real interest rates, and nominal interest rates, are important in consumption and gross investment decisions. Higher rates of interest will reduce both. Lower rates of interest will increase both. Reminder: there are two types of investment, real and financial. When discussing AD, LFM, etc. we are looking at real investment, which is the purchase of factories, tools and machinery for business. Money Market Graph: The money market is different from loanable funds and from currency markets. Money Market is the supply and demand for money to make daily transactions and to hold as an asset.