Transcription of ALLAN VARIANCE ANALYSIS ON ERROR …
1 HENRI COANDA GENERAL STEFANIK AIR FORCE ACADEMY ARMED FORCES ACADEMY ROMANIA SLOVAK REPUBLIC INTERNATIONAL CONFERENCE of SCIENTIFIC PAPER AFASES 2014 Brasov, 22-24 May 2014 ALLAN VARIANCE ANALYSIS ON ERROR CHARACTERS OF LOW-COST MEMS ACCELEROMETER MMA8451Q Marin MARINOV*, Zhivo PETROV* *Aviation Faculty, NVU V.
2 Levski , Dolna Mitropolia, Bulgaria Abstract: This paper gives an evaluation of low-cost MEMS digital accelerometer errors . Such evaluation is required to construct an appropriate model of the accelerometer. ALLAN VARIANCE is a simple and efficient method for verifying and modelling the errors by representing the root mean square random drift ERROR as a function of averaging time. In this paper the characteristics of MEMS accelerometers stochastic errors are identified and quantified, using ALLAN VARIANCE .
3 The derived ERROR model can be applied further to navigation systems of small aircraft. Keywords: accelerometer, ALLAN VARIANCE , bias instability, ERROR , random walk, rate random walk. 1. INTRODUCTION Advances in the Micro-Electromechanical Systems (MEMS) technology combined with the miniaturization of electronics, have made possible to introduce light-weight, low-cost and low-power chip based inertial sensors for use in measuring of angular velocity and acceleration [9]. MEMS accelerometers output the aircraft acceleration which is used to obtain the position and velocity.
4 The accuracy of accelerometer measurements usually depend on different types of ERROR sources, such as bias, bias instability, velocity random walk, rate random walk, etc. By integrating these measurements in the navigation algorithm, these errors will lead to a significant drift in the position and velocity. To improve the accuracy of aircraft navigation system, different kinds of algorithms are used, integrating accelerometer measurements with other sensors such as GPS receivers [8].
5 To achieve an accurate estimation of aircraft navigation parameters a good model of sensors errors is required. The errors are caused by noise sources which are statically independent, and many approaches for modeling noise are developed. The frequency-domain approach is based on the power spectral density (PSD) [7]. Several time-domain methods have been devised for stochastic modeling [4,14].The simplest and most used is the ALLAN VARIANCE time-domain- ANALYSIS technique, originally developed in the mid-1960s to study the frequency stability of precision oscillators [1, 2, 3, 5, 6, 12].
6 ALLAN VARIANCE is a directly measurable quantity and can provide information on the types and magnitude of various noise terms. The method has been adapted to random-drift characterization of a variety of devices including MEMS accelerometers [15, 16]. In this paper, the ALLAN VARIANCE time-domain- ANALYSIS technique is used to characterize the 3-axis, 14-bit/8-bit digital accelerometer MMA8451Q. 2. ALLAN VARIANCE METHOD If the instantaneous output of the accelerometer is , the cluster average is defined as: ()ta()()dttaakkttk += 1, (1) where () ka represents the cluster average of the output acceleration for a cluster which starts from the k-th data point.
7 The definition of the subsequent cluster average is: ()()dttaakkttk +++= 21. (2) The difference between the two cluster averages () kd is: ()()() kkkaad =+. (3) The VARIANCE of differences between every two adjacent cluster averages is given by: () 2d()()()22kkdd =, (4) where: k is the mean of () kd; is the ensemble average.
8 The ALLAN VARIANCE as function of averaging time is defined as: ()()222 d=. (5) Since in digital accelerometers the output data are available in discrete form (5) becomes: ()()()() = =1122121 KkkkdnTdKnT , (6) where: is the number of samples in one cluster; K is number of clusters; T is sample time. nIt can be shown that the percentage ERROR , in estimating the ALLAN standard deviation of the cluster due to the finiteness of the number of clusters is given by [10]: =121nN , (7) where N is the number of samples in the data set.
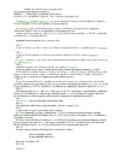
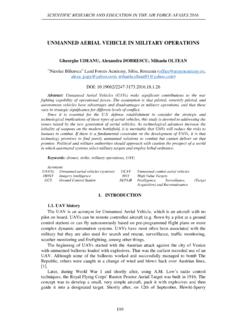
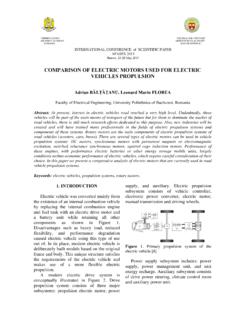
9 To ensure percentage ERROR less than 25% the following expression is obtained from (7): 99 NnnN (8). Consequently the number of clusters has to be not less than nine. Different types of random processes cause slopes with different gradients to appear on the log-log plot of ALLAN standard deviation [11], as shown in Figure 1. Furthermore, different processes usually appear in different regions of , allowing their presence to be easily identified [16].
10 Figure 1. A possible log-log plot of ALLAN Deviation ANALYSIS results The values of the parameters could be obtained directly from the plot. For a MEMS device such as MMA8451Q the important processes that have to be measured are random walk, bias instability and rate random walk. The random walk is white noise and appears on the plot with a slope The deviation of random walk is obtained by the following expression [11]: ()00 =rw, (9) where the plot of () has the slope of for 0 =.