Transcription of AMERICAN LUNG ASSOCIATION
1 AMERICAN LUNG ASSOCIATION STATE OF THE AIR 2015 1 AcknowledgmentsThe AMERICAN Lung ASSOCIATION State of the Air 2015 is the result of the hard work of many people: In the AMERICAN Lung ASSOCIATION National Office: Paul G. Bill-ings, who supervised the work; Janice E. Nolen, MA, who directed the project, analyzed data, wrote the text, and coordinated print and web presentations; Lyndsay Moseley Alexander, who helped integrate the Healthy Air Campaign with this report; Zach Jump, MA, who converted the raw data into meaningful tables and comparisons and calculated all the population data; Susan Rappaport, MPH, who supervised the data analysis; Norman Edelman, MD, and Al Rizzo, MD, who reviewed the science and health discussions.
2 Neil Ballen-tine, who directed the online presentation; Todd Nimirowski, Lauren Innocenzi and MacKenzie Olsberg, who managed content produc-tion online; Laura Lavelle, who developed social sharing and digital engagement strategy; Kim Lacina, Allison MacMunn, and Gregg Tubbs, who coordinated internal and external communications and media outreach; Michael Albiero, who designed the logo and report cover; and Craig Finstad, who coordinated sharing the data with direct mail the nationwide AMERICAN Lung ASSOCIATION : All Lung ASSOCIATION charters reviewed and commented on the data for their states.
3 Hard-working staff across the nation went out of their way to ensure that their state and local air directors were informed and had a chance to review the draft data. Outside the AMERICAN Lung ASSOCIATION : Allen S. Lefohn of and Associates, who compiled the data; Deborah Shprentz, who assisted with the research and review of the science; Beaconfire Consulting, who uploaded the data to the website; and Our Designs, Inc., who designed the print appreciation goes to the National ASSOCIATION of Clean Air Agencies, who along with their Executive Director Bill Becker, strove to make this report better through their comments, review and concerns.
4 Many of their members reviewed and commented on the individual state data presented and the methodology to make this report more accurate. We appreciate them as our partners in the fight against air pollution. This report should in no way be construed as a comment on the work they do. A key partner in this work is the Environmental Protection Agency. The professional staff of the Agency has long been dedi-cated to the fight for clean air. The AMERICAN Lung ASSOCIATION assumes sole responsibility for the content of the AMERICAN Lung ASSOCIATION State of the Air Lung AssociationNational Headquarters 55 W.
5 Wacker Drive, Suite 1150 Chicago, IL 60601 Advocacy Office 1301 Pennsylvania Avenue, NW, Suite 800 Washington, DC 20004 Phone: 1 (800) 586-4872 Fax: (202) 2015 by the AMERICAN Lung AssociationAmerican Lung ASSOCIATION , State of the Air, and Fighting for Air are registered trademarks of the AMERICAN Lung for AirDesigned by Our Designs, Inc., Nashville, TN THE STATE OF THE AIR 2015 1-800-LUNGUSA 2 1-800-LUNGUSA 2 ContentsThe State of the Air P eople at Risk in the ..10 Most Polluted Cities in the Most Polluted Counties in the Cleanest Cities in the.
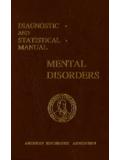
6 17 Cleanest Counties in the ..19 Health Effects of Ozone and Particle Pollution ..26 Methodology ..38 State Tables ..43 STATEAIROF THE2015 THE STATE OF THE AIR 2015 1-800-LUNGUSA 3 Figure 1 Air emissions have dropped steadily since 1970 thanks to the Clean Air Act. Even as the economy continues to recover from the recession, emissions that contribute to the most widespread pollutants continue to drop. (Source: EPA, Air Quality Trends, 2015.)The State of the Air 2015 shows that progress in improving the nation s air quality was mixed.
7 Many cities experienced strong improvement and many others suffered worse epi-sodes of unhealthy air. While most of the nation has much cleaner air quality than even a decade ago, a few cities even reported their worst episodes. Nearly million people almost 44 percent of the nation live where pollution levels are too often dangerous to breathe. Fortunately, that represents fewer people exposed than in our previous report. Despite that risk, some seek to weaken the Clean Air Act, the public health law that has driven the cuts in pollution since 1970, and to undermine the ability of the nation to fight for healthy State of the Air 2015 report looks at levels of ozone and particle pol-lution found in official monitoring sites across the United States in 2011, 2012, and 2013.
8 The report uses the most current quality-assured nationwide data available for these analyses. The report examines particle pollution ( ) in two different ways: av-eraged year-round (annual average) and over short-term levels (24-hour). For both ozone and short-term particle pollution, the analysis uses a weighted average number of days that recognizes places with higher levels of pollution. For the year-round particle pollution rankings, the report uses averages calcu-lated and reported by the Environmental Protection Agency (EPA).
9 For comparison, the State of the Air 2014 report covered data from 2010, 2011, and TrendsThanks to stronger standards for pollutants and for the sources of pollution, the United States has seen continued reduction in ozone and particle pollution as well as other pollutants for decades. Figure 1 from the EPA shows that since 1970, the air has gotten cleaner while the population, the economy, Gross Domes c ProductVehicle Miles TraveledPopula onEnergy Consump onCO2 EmissionsAggregate Emissions(Six Common Pollutants)
10 240%220%200%180%160%140%120%100%80%60%40 %20%0% 20% 40% 60% 80%70 80 90 95 96 97 98 99 00 01 02 03 04 05 06 07 08 09 10 11234%168%54%44%24%-68%12 13 State of the Air 2015 shows that more than four out of ten people had unhealthy air quality in their THE2015 THE STATE OF THE AIR 2015 THE STATE OF THE AIR 2015 1-800-LUNGUSA 4 energy use and miles driven increased greatly. Even as the economy continues to recover after the recession, overall air emissions that create the six most widespread pollutants continue to drop.