Transcription of An IEC 61000-4-30 Class A - Power Quality monitor …
1 An IEC 61000 -4-30 Class A - Power Quality monitor Development and performance analysis Andres E. Legarreta Julio A. Bortolin Engineering and development department Engineering and development department Ecamec Tecnolog a Ecamec Tecnolog a Buenos Aires, Argentina Buenos Aires, Argentina Javier H. Figueroa Engineering and development department Ecamec Tecnolog a Buenos Aires, Argentina Abstract Power Quality assessment is today one of the main complete set of regulations to describe the whole spectrum of ways to improve energy efficiency. International standards tend electric magnitudes related to Power Quality led to differences to restrict the way this assessment is done, by defining the in the results, depending on the manufacturer of the instrument, measurements methods that should be adopted by an instrument. and the conditions that were applied. This situation turned the This work describes some of the constrictions and requirements comparison difficult, when not impossible.
2 Assumed for the design of the high performance Power Quality During year 2003 the IEC 61000 -4-30 was presented data logger PQ1000, taking into account the international standards IEC 61000 -4-30 Class A and the IEC 61000 -4-15 and its new edition was released in 2008. IEC 61000 -4-30 Ed. published in August 2010. Trough it, the most important [1] as its predecessor defines Class A instruments as the demands of the IEC 61000 -4-30 Class A instruments are exposed. ones applied in contractual subjects, standard compliance Details of the hardware components are also shown, and the most verification, and disputes resolution. Its main objective is that important points of the signal processing path are explained. The measurements from different instruments of different performance in the RMS values determination is given, also the manufacturers and models will give identical results within the frequency response for harmonics measurement are shown, and a uncertainty band when connected to the same signal.
3 It defines detailed analysis of fulfillment of the tests given in the IEC 61000 - the measurement methods establishing a guide for results 4-15 ed. 08-2010 are given in the final section. Before the interpretation and a performance specification, not for design of publication of this the Cigr 2. CCO2/UIE WG2 - 2004 protocol was the reference document that the instrument. in addition with the IEC standard was used for the evaluation of II. IEC 61000 -4-30 ED. - 2008-10 - MAIN REQUIREMENTS. digital flicker meters. This protocol aim is to guarantee a higher degree of compatibility between instruments of different Table 1 presents the main measurement requirements manufacturers and models. The tests here presented intend to exposed in the standard for the Class A instrument [1]. submit the equipments to a more real situation, and try to show possible hardware or firmware defects. The results given by the TABLE 1. RANGES AND TOLERANCES. PQ1000 widely surpasses the standards exigencies.
4 Uncertainty Ranges Key words: Power Quality Data Logger, IEC 61000 -4-30 Class A, Parameter Tolerances IEC 61000 -4-15, Harmonics, Flicker. IEC PQ1000 IEC PQ1000. 50 Hz 7,5 Hz Frequency 10 mHz <2,5 mHz 60 Hz 9 Hz I. Power Quality MONITORING. Voltage 10 ~ 150. Power Quality assessment in electrical energy distribution 10 ~ 200% 0,1% <0,025%. TrueRMS % UDIN. obeys to control entities requirements, user complains, and Current Acc. Traducer Range 0,1% FS <0,025%. network maintenance schedules. The instruments applied must allow the complete analysis of the supplied magnitudes: Flicker 0,2 ~ 10 0,2 ~ 20 5% <2,5%. Voltage and current, mains frequency, polyphase system PST/PLT. unbalance, voltage events as dips, swells and interruptions, Unbalance u2. 0 ~ 5% 0 ~ 100% 0,15% <0,05%. harmonic and interharmonic content, flicker and transients. y u0. From several years, the RMS voltage, the spectral content and flicker were defined by the standards, but the absence of a Ranges Uncertainty to the 50 order.
5 The determination of all the spectral Parameter Tolerances components should be done in real time without gaps IEC PQ1000 IEC PQ1000 (continuous sampling). Voltage 0 ~ 200% 5% <1% Flicker: It is defined by the IEC 61000 -4-15 standard [3]. Harmonics The uncertainty required is 5% for PST in the levels of 0,2 to Interharm. V/V @ PST = 2 5% <1% 10. This parameter is further analyzed in detail. Additional requirements: The normative [1] establishes Every Class A instrument should give the same results influence quantities ranges that the instrument should withstand when connected to the same stimulus. The reduced tolerances with its results within the uncertainty levels stated in the for magnitudes, the combination of tests, and the unique time standard. aggregation method restricts the performance of this kind of equipment. This normative also defines two additional classes, III. REFERENCE INSTRUMENT FOR TESTING. Class S and Class B, focused on statistical survey and for The validation of the instrument consisted in hardware, preliminary measurement respectively.
6 Firmware and software tests. The electrical parameters Aggregation Intervals: Are the time periods during which calibrator Fluke 6100A [4] was used in ECAMEC. the instrument should average measures. The standard defines measurement laboratory during the development stage. four basic intervals for 50Hz systems: 10 cycles of fundamental Preproduction samples were tested in governmental frequency, 150 cycles (aggregated from fifteen 10 cycles laboratories facilities, testing compliance with measurement intervals), 10 minutes (determined with an absolute internal techniques and uncertainty levels, electrical safety, clock) and a 2 hour interval (aggregated from twelve 10 environmental and electromagnetic compatibility. minutes intervals). All the parameters measured (in exception of mains frequency) should be processed using this time IV. IMPLEMENTED HARDWARE IN DATA LOGGER. scheme, in real time without samples loss. See Fig. 1. ECAMEC - PQ1000. Time reference: Real time internal clock uncertainty is According to the requirements established in the standard defined in 20ms for 50Hz mains systems.
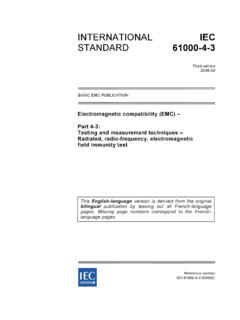
7 Periodical re- [1], the hardware was developed with suitable capacity for its synchronization is demanded by remote (for example GPS) or accomplishment and for future performance upgrades. Fig. 2. local technique, if this external synchronization is not available, presents a simplified hardware block diagram of the PQ1000. time uncertainty should not exceed 1 second each 24hs. [5] components. Mains Frequency: Zero crossing technique for periods of RTC. 10 seconds is proposed by the standard, but other methods are ADC8. ANAL GICA. ADAPTACI N. accepted if the results uncertainty is equivalent. Maximum END. uncertainty is 10mHz in the range of 15% of the nominal ANALOG. frequency: 50 and 60 9Hz. DEFRONT. DataCTRL. Logger DSP PLL. Controller REGISTRO. RMS Voltage: Uncertainty of 0,1% of the nominal voltage ETAPA. is required in the range of 10% to 150% of the nominal voltage. ADC4. Harmonics and Interharmonics: Class A defines its restrictions based in the IEC 61000 -4-7 Class I standard [2] up Fig.
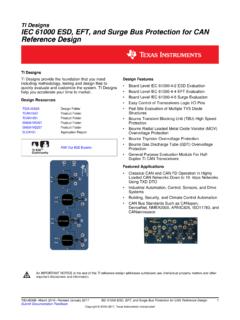
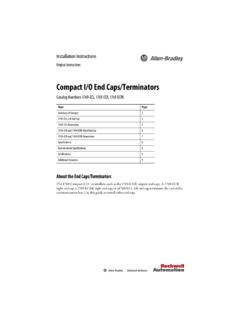
8 2. Hardware block diagram Fig. 1. Time aggregation scheme (figure from IEC 61000 -4-30 2008, Class A aggregation method). Fig. 3. Flicker Meter block diagram Data logger controller: This stage controls the data memory and the communication interface for data to be read from a PC. RTC (Real Time Clock): Is the time reference for the 10. minutes interval required. Its uncertainty is better than 2 ppm, giving a stability better than 0,2 seconds a day. DSP (Digital Signal Processor): The measurements algorithms are implemented by this stage. It is a 32 bit floating point architecture, with maximum capacity of Gflops. PLL: Phase Lock Loop programmable oscillator that provides the sampling frequencies for the two ADCs (Analog to Digital Converter). It is feed backed with the mains frequency value. ADC8: 24 bit, 8. Fig. 5. Maximum relative error channel analog to digital converter. Except Flicker and mains frequency, all the other magnitude measurements are ADC4 stage is aimed to the measurement process of mains accomplished with the samples provided by this stage.
9 ADC4: frequency and flicker PST-PLT. It has embedded the blocks 24 bit, 4 channel analog to digital converter. It provides the defined by the flicker meter standard [3]. Frequency is samples for the flicker measurement process and for the mains measured while the demodulation process is accomplished, frequency calculation used to feedback the PLL stage. Analog through a digital Hilbert Transform. Front End: Operational amplifiers arrange that conditions the What follows is an explanation about the functionality of analog signal prior to the sampling process. each block according to [3] (see Fig. 3), and the Figure 2 shows the analog stage plus the sampling stage implementation details in the PQ1000. performance. The FFT of the signal acquired by the ADC8 Bock 1: The level of input voltage is adapted with an stage is shown. Note that the noise floor is below 100dB, see automatic gain control (AGC) to provide the next block with a Fig. 4. constant level input. Block 2: Demodulation of the signal with a quadratic V.
10 ALGORITHM STRUCTURE multiplier according to [3]. In the PQ1000 scheme this block is The measurements and calculations are structured in two replaced with a Hilbert transform process [6][7][8], giving the main sections: ADC8 and ADC4. The ADC8 which has 8 amplitude modulation signal of the mains. This process simultaneous acquisition channels processes the voltage and provides information sample by sample of the voltage phasor in current signals, obtaining the RMS values and electric Power the fundamental frequency, in module and phase (see Fig. 6). magnitudes measured by the PQ1000. Fig. 5 shows the With this information the AM is obtained and also the accuracy and stability of voltage measurements obtained for frequency of mains is measured with an uncertainty lower than each channel from 10 cycles buffers through a period of ten 10mHz (see Fig. 7). The frequency obtained in this stage is minutes. then used to shift the sampling frequency for the FFT and RMS. applications (ADC8 section).