Transcription of An International Comparison of Gender Equality: Why Is …
1 An International Comparison of Gender equality : Why Is the Japanese Gender Gap So Persistent? * *. Margarita Est vez-Abe Syracuse University and Collegio Carlo Alberto, Turin (Italy). When it comes to Gender equality , Japan lags behind other advanced countries despite the introduction of Equal Employment Opportunity Act in 1985. This article discusses institutional conditions that promote Gender quality in the market place, and shows those conditions are largely lacking in Japan. Gener- ally speaking, many consider Scandinavian countries as vanguards of Gender equality .
2 These countries have adopted extensive policy support enabling mothers to balance work and family. This article argues that mother-friendly policies are not the only factors that explain the relative economic position of men and women . It uses the US and Spain in order to highlight different insti- tutional scenarios to promote Gender equality . The economic position of Span- ish women used to be as low as that in Japan. More specifically, this article discusses the equalizing effects of the following institutional conditions: (i). strong anti-discrimination laws matched with class action suits, (ii) the pres- ence of professionally-oriented educational systems that allow women with academic abilities entry into high status occupations; (iii) market conditions that enable women to outsource their unpaid domestic work; and (iv) availabil- ity of contraceptive methods that give women control over their reproductive decisions.
3 I. Introduction A quarter-century has passed since the enactment of the 1985 Equal Employment Opportunity Act in Japan. The economic status of Japanese women , however, remains well below average as compared with women in other developed nations as the recent Gender report published by OECD highlighted (OECD 2012). This paper conducts an International Comparison to examine the problems with the employment environment for women in Japan and the efforts taken to address them. II. Gender equality in Employment in the Developed Nations Different measurements are used to capture the degree of Gender equality in employ- ment.
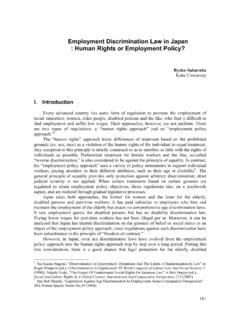
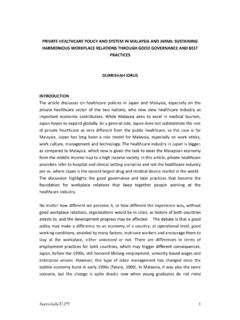
4 By any measure, women 's social progress in Japan has lagged far behind other na- tions. Figure 1 compares the employment rates of women in advanced industrial countries. The columns to the left show the employment rates of women aged 25 to 49, while the col- umns to the right show the employment rates of mothers who have children under the age of *. This article is based on the research supported by the Abe Fellowship provided by the Social Sci- ence Research Council and the Japan Foundation Center for Global Partnership. 82. An International Comparison of Gender equality Source: OECD Family Database online (2011), Chart Figures from 2008.
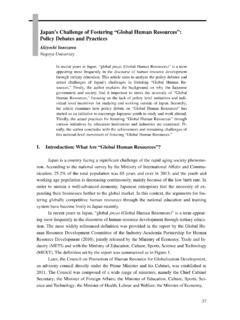
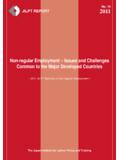
5 Figure 1. Maternal Employment Rates (%). 15. This figure shows that Japan has the lowest employment rates of women /mothers, on par with the countries of southern Next, let us look at the wage gap between men and women who work full time. Fig- ure 2 shows Gender wage gap (how much more men earn relative to women ) among men and women in the bottom and top quintiles of wage distribution in respective countries. Let us examine the overall trend in Gender wage gap first. Japan and South Korea stand out for their large Gender gaps. Surprisingly, the Gender wage gaps are very small in Southern European countries despite that fact that they resemble East Asian countries such as Japan and South Korea in their low female employment rates (as shown in Figure 1).
6 The US, Australia, New Zealand, France, and Nordic countries (with the exception of Den- mark) demonstrate an interesting pattern. These countries have small Gender gaps among men and women in the bottom quintile, but big gaps among men and women in the top quintile. In fact, the Gender wage gap among high earners in this group of countries is as large as in Japan and South Korea. This pattern that is much bigger Gender gap among high earners suggests that occupations and workplaces that offer high wages are still largely dominated by men. It is important to emphasize that this trend is evident in Nordic countries, which have a strong reputation for Gender equality .
7 Finally, Germany, Austria, Canada, the Netherlands, Denmark, and Belgium demonstrate a more uniform pattern of Gender wage gap. In these countries, the magnitude of Gender wage gap does not change by 1. Public childcare services are not very developed in the English-speaking regions of Canada, but are quite heavily developed in the Quebec and French-speaking areas. In countries like Germany, Switzerland, and Belgium where policy responsibilities are decentralized, the rates of development of public childcare differ significantly across municipalities and regions even within the same country.
8 83. Japan Labor Review, vol. 10, no. 2, Spring 2013. Source: OECD Family Database online (2011), Chart Figure 2. Gender Gap in Full-Time Earnings at the Top and Bottom of the Earnings Distribution (%), 2008. quintiles. Scholars explain the presence of Gender wage gap in terms of factors such as discrim- ination against women , differences in human capital (education and experience) and occu- pational segregation by sex (Mincer and Polachek 1974; Charles and Grusky 2004; Charles et al. 2001). Although Figure 2 does not control for these kinds of personal attributes, the OECD data on the length of enterprise tenure (a proxy for work experience) and female enrolment rates in tertiary education show that Japan lags behind other advanced industrial Occupational segregation by sex can be measured in different ways, and a number of indices exist.
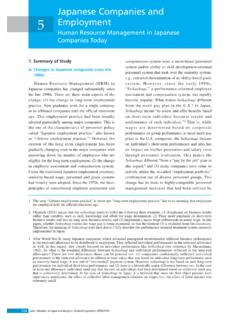
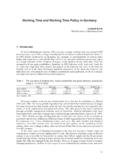
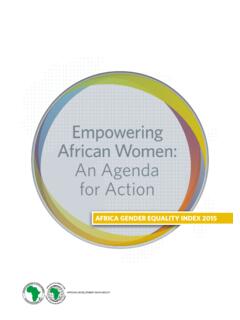
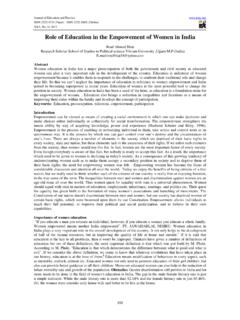
9 Here, I will look at two simple measures of female advancement into selected high status occupations traditionally dominated by men: (i) the proportion of women in up- per-level occupations (corporate managers, top government leaders, and politicians, Figure 3); and (ii) the proportion of women in professional occupations, such as researchers (Fig- ure 4). In Japan, the proportion of women in such positions is extremely low. In contrast, English-speaking countries like the US, and Nordic countries score very high on women 's social advancement by most measures. It is worth noting that women in English-speaking countries enjoy a higher status than women in Nordic countries countries renowned for their commitment to Gender equality and generous family-work reconciliation policies 2.
10 In advanced industrial countries, the rate of university advancement among women has long been higher than that among men, but in Japan, the number of male university students still exceeds the number of female students (see OECD Education at a Glance for each year). 84. An International Comparison of Gender equality Source: United Nations Development Program, Human Development Report 2008. Figure 3. Ratio of women in Managers, Government Officials and Politicians (%). Source: Cabinet Office (2011, figure 35). Figure 4. Ratio of women among Researchers/Scientists (%).