Transcription of AN INTRODUCTION TO GEOGRAPHIC INFORMATION …
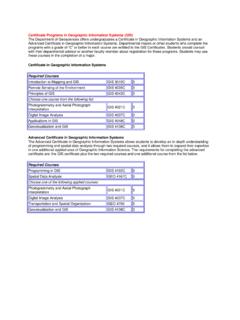
1 AN INTRODUCTION TO GEOGRAPHIC INFORMATION SYSTEMS (GIS) FOR THE CROP CRISIS CONTROL PROJECT USING DIVA GIS PREPARED BY CHRISTOPHER LEGG C3P CONSULTANT MARCH 2007 1) INTRODUCTION This manual was prepared for GIS training courses organised by the Crop Crisis Control Project (C3P) in the Great Lakes region of East Africa in 2007, and also to be retained by trainees as a reference on the important GIS techniques taught during that course. It could also be used for self-training in DIVA software by others in the region. The manual must be used with DIVA software version , and with the data sets for C3P provided by IITA. The preparation of the manual was funded by the USAID Famine Fund through C3P, and has been released with permission of USAID and C3P. DIVA is a GIS software package originally developed at CIP (International Potato Centre) in Peru by Robert Hijmans and others, and further refined by Hijmans at the University of California, Berkeley.
2 DIVA has been selected by IITA for use in agricultural research and development programmes in Africa because of its ease of use, flexibility, compatibility with other software and common data formats, and because it is free of charge. It has many built-in functions which are of special interest to those working in plant genetics, and which will probably not be of great interest to the current trainees, but as they progress in their understanding of the software they may find these useful as well. This training course and manual are focussed on enabling new GIS users to produce a range of maps for reports and presentations using existing free data-sets compiled by IITA, and also to incorporate their own new data, acquired by GPS, into their maps. A more comprehensive guide to the use of DIVA is in preparation, but this manual should enable trainees to make a start in this exciting and useful manual is organised as a series of lessons which introduce users step by step to the concepts and operations of GIS.
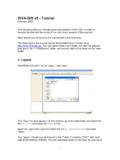
3 Each lesson should take the user between one and two hours to complete the first time round. It is suggested that all trainees repeat each lesson at least twice in order to become completely familiar with all the functions. The lessons should be tackled strictly in order, since later lessons assume knowledge of many operations covered in previous lessons. 2) Lesson 1. Producing a map of the C3P project area You may often need maps showing the location of the C3P project area for use in reports or Powerpoint presentations. This lesson shows you how to produce such a map, and introduces you to many simple operational techniques in Diva. All the data used in this lesson is in the /training_data directory of the data which you have been provided. Double-click the DIVA icon on your desktop. A blank DIVA window will appear, as shown in Figure Resize this window as you wish on your screen Figure Blank data window when opening DIVA Figure Selecting a shapefile to open Click on the + button on the DIVA toolbar.
4 Navigate to the /training_data directory, and select the shapefile National_Boundaries . Click Open . The map shown in Figure will appear. Diva automatically scales the display to the full extent of the theme which you open, and applies a default legend with no fill (colourless, transparent polygons) and a black outline. Figure National Boundaries of Africa, with default legend, no fill Fig. The Properties dialogue box for National Boundaries Figure Symbol dialogue Fig. Colour dialogue box Fig. Symbol box after modifying fill and colour We wish to change the way in which this map is displayed, which means changing the Legend . Double-click on the legend for National Boundaries . The Properties dialogue box for National Boundaries appears, as shown in Figure Click once on the symbol in the preview window of this dialogue box.
5 The Symbol dialogue box is now displayed (Figure ). This allows you to change the type of fill of your map polygons, with a choice of no fill , solid fill and a range of cross-hatching. It also allows you to change the colour of the fill and the presence or absence of a border line and its colour. First, change the style to solid fill from the default of no fill . Next, click once on the Color button. This will open the Color dialogue box, as shown in Figure This allows you to select fill and border colours, either from a palette of pre-defined colours or from custom user-defined colours. For the present we will use the pre-defined colours. Select the pale grey from the right of the bottom row of the palette and then click on the OK button at bottom left. The Symbol dialogue box now appears as in Figure , with a solid pale grey fill and a black outline. Click OK to apply this change to your map, which should now look like Figure Figure Map of National Boundaries after changing fill style and colour Fig.
6 Changing legend of C3P_area Fig. New legend for C3P_area We now need to add the area covered by C3P. Find the shapefile c3p_area in the /training_data sub-directory and add it to the view. The default legend will be a black outline with no fill. Double-click on the legend to obtain the properties dialogue window, then single-click on the preview to go to the symbol window (Figure ). Change the style to SOLID FILL, the colour to pale pink, and remove the outline. Click OK and APPLY the new legend (Figure ). The resulting map should be as shown in Figure , with the whole of Africa in pale grey with black country boundaries, and the project area in pink without outline. Figure After adding C3P_area and changing legend Since water bodies are particularly important in the East African Great Lakes area, we should now add lakes and major rivers to our map. Maps of lakes are available at a range of scales.
7 For regional maps, the shapefile afwater provides sufficient detail without being so complex that it takes too long to draw. Select this file from the Region sub-directory as shown in Figure , and add it to the view. Figure Selecting afwater , a map of lakes and rivers Figure Default legend for afwater , black outline and no fill DIVA applies the default legend of solid black boundaries and no fill to all polygon files (Figure ), so the legend for afwater must be modified to a solid blue fill with no outline for best representation of lakes and rivers, to give the result shown in Figure Figure afwater legend modified to solid blue fill with no outline We now need to zoom in so that we see only the C3P project area. There are two ways that we can do this. One is by using the ZOOM tool button (7th button from left). Click on this tool and then draw a box around the area of the C3P project.
8 The view will then zoom into the area defined by the box. The other method is to highlight, in the Legend Window, the name of a theme covering the area to which you wish to zoom (in this case the theme c3p_area ) and then to click on the ZOOM to SELECTED button (5th from left). Figure shows the effect of zooming with the zoom box tool to an area larger than just the C3P project area. Figure Zoom in to focus on C3P countries The c3p_area theme now overlays the national boundaries, so that we cannot see them within the project area. In order to have the national_boundaries theme both as a polygon theme with a light grey fill, and with no fill but solid boundaries above the c3p_area theme, we must have two copies of this theme in the view. Add another copy of national boundaries to the view (). By default, it has no fill and a solid black outline, and is installed at the top of the legend window.
9 The result is shown in Figure Figure National boundaries superimposed on C3P shapefile We will now learn how to add name labels to the view. Names could be typed manually onto maps in the GIS, but this would be very time-consuming. It is faster and easier to add names from the attribute tables of themes in the view. Figure Country names using the NAME field in National Boundaries Change the legend of the lower version of the theme national_boundaries to NO FILL to make the display more clear for the following operations. Highlight the top version of the theme national_boundaries . Click on the LAYER menu, and select the menu item ADD LABELS. A dialogue window will appear. Select the field NAME and click on OK. Name labels will appear in all the countries in the view, but note that there are many extra labels for Kenya, Figure Only one name per country from the PRINT NAME field Tanzania and Mozambique.
10 This is because each one of these coastal countries has numerous offshore islands, each one a polygon and each one with the name of the country in the NAME attribute field. Some GIS software will allow us to suppress duplicate names, but not DIVA, so an alternative approach must be used to generate an acceptable map. In the attribute table of national_boundaries , a new attribute called PRINT_NAME has been added, with names only for the largest polygon in each country. If this attribute is selected for the ADD LABEL function, and the SET FONT button is used to select Arial Bold, the map shown in Figure will result, with only one name per country. Figure Background colour restored and map ready for export The pale grey solid fill shade is replaced in the lower one of national_boundaries , and the view is now ready for export as an image for use in reports and presentations.