Transcription of An introduction to R
1 An introduction to RLonghow LamUnder Construction Feb-2010 some sections are unfinished!longhowlam at gmail dot comContents1 What is R? .. The R environment .. Obtaining and installing R .. Your first R session .. The available help .. on line help .. R mailing lists and the R Journal .. The R workspace, managing objects .. R Packages .. Conflicting objects .. Editors for R scripts .. editor in RGui .. editors ..162 Data Data types .. and Times .. data and Infinite values.
2 Data structures .. frames .. objects ..413 Importing Text files .. Excel files .. Databases .. The Foreign package ..464 Data Vector subscripts .. Matrix subscripts .. Manipulating Data frames .. data from data frames .. columns to a data frame .. data frames .. data frames .. data frames .. columns of data frames .. data .. Attributes .. Character manipulation .. functionsnchar,substringandpaste.. patterns in character objects .. characters.
3 Characters .. Creating factors from continuous data ..685 Writing introduction .. Arguments and variables .. and optional arguments .. argument .. variables .. an object .. Scoping rules .. evaluation .. Control flow .. withifandswitch.. withfor,whileandrepeat.. Debugging your R functions .. through a function ..836 Efficient Vectorized computations .. The apply and outer functions .. Using Compiled code .. Some Compiled Code examples .. arsim example.
4 #include < >.. R expressions in C ..987 introduction .. More plot functions .. plots .. or more variables .. Devices .. Modifying a graph .. parameters .. handy low-level functions .. the axes .. Trellis Graphics .. panel graphs .. panel functions .. plots .. The ggplot2 package .. with several layers .. 1348 Basic statistical functions .. summaries and tests .. distributions and random numbers .. Regression models.
5 Objects .. Linear regression models .. objects .. functions .. (categorical) variables as regression variables .. Logistic regression .. modeling functionglm.. measures .. ability of a logistic regression .. Tree models .. example of a tree model .. classification and binning .. Survival analysis .. Cox proportional hazards model .. models for survival analysis .. Non linear regression .. models .. value decomposition .. 1779 Miscellaneous Object Oriented programming .
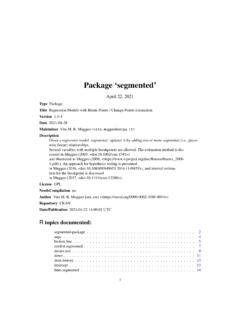
6 Style classes .. Style classes .. R Language objects .. and Expressions .. as Lists .. as lists .. Calling R from SAS .. systemandXfunctions .. SAS data sets and SAS ODS .. Defaults and preferences in R, Starting R, .. and preferences .. R .. Creating an R package .. private package .. real R package .. Calling R from Java .. Creating fancy output and reports .. simple LATEX-table .. simple HTML report .. 206 Bibliography207 Index2084 List of The R system on Windows.
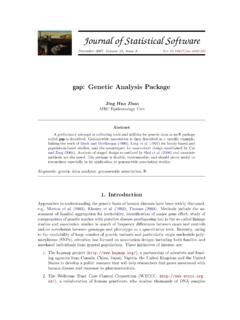
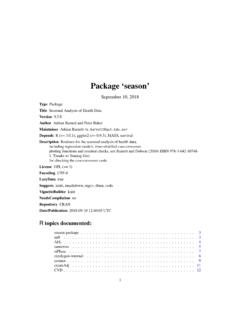
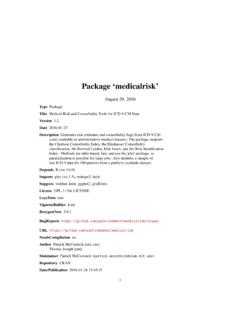
7 R integrated in the Eclipse development environment .. The Tinn-R and an the R Console environment .. A surface plot created with the functionpersp.. Calculation times ofarsimR(solid line) andarsimC(dashed line) forincreasing vectors .. A scatterplot with a title .. Line plot with title, can be created withtype="l"or thecurvefunction. Different uses of the functionplot.. Example distribution plot in R .. Example barplot where the first argument is a matrix .. Example graphs of multi dimensional data sets.
8 The different regions of a plot .. The plotting area of this graph is divided with thelayoutfunction.. Examples of different symbols and colors in plots .. The graph that results from the previous low-level plot functions.. Graphs resulting from previous code examples of customizing axes.. Trellis plot Price versus Weight for different types .. A trellis plot with two conditioning variables .. Histogram of mileage for different weight classes .. Trellis plot with modified panel function.
9 Trellis plot adding a least squares line in each panel .. A coplot with two conditioning variables .. A coplot with a smoothing line .. A histogram and a qq-plot of the model residuals to check normality ofthe residuals.. Diagnostic plots to check for linearity and for outliers.. Explorative plots giving a first impression of the relation between thebinaryyvariable andxvariables.. The ROC curve to assess the quality of a logistic regression model .. Plot of the tree: Type is predicted based on Mileage and Price.
10 Binning the age variable, two intervals in this case .. Survival curve: 10% will develop AIDS before 45 months and 20% before76 months.. Scatter plot of the martingale residuals .. Three subjects with age 10, 30 and 60 .. Scatter plot of our simulated data fornls.. Simulated data andnlspredictions .. Hill curves for two sets of parameters .. Result of the specific plot method for class bigMatrix.. Some Lissajous plots .. A small java gui that can call R functions.