Transcription of An overview of suicide statistics - Ministry of Health NZ
1 An overview of suicide statisticsThis document summarises information about suicide deaths in New Zealand covering up to 2013. It does not attempt to explain causes of suicidal behaviour or causes of changes to suicide oriPacificAsianEuropean &OtherNZ suicide death rate (per 100,000) by ethnicityMaleFemaleTotal3651430%20%40%60 %80%100% suicide deaths in 2013 by genderMaleFemale0510152015 2425 4445 6465+ suicide rate in 2013 by life-stage age times more men died by suicide than women in 2013508 the number of suicide deaths in deaths per 100,000 people was the suicide rate in 2013M ori have higher suicide rates than other ethnic groupsYouth (15 24 years)
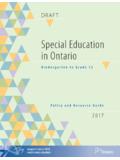
2 Have higher suicide rates than other life stage age groups10%20%40%60%European and OtherM oriPacificSuicide deaths (percentage) by ethnic deprivation1 (Lowest Deprivation)2345 (Highest Deprivation)Ethnicity and Deprivation0102030405060 suicide rates by ethnicity and five-year age group (from 5 years of age), 2009-2013M oriPacificAsianEuropean & Other0%10%20%30%1 (leastdeprived)2345 (mostdeprived)Percentage of suicide deaths by deprivation quintileSuicide rates among M ori and Pacific peoples decrease with age whereas suicide rates among European and Other people do ori youth have higher suicide ratesthan youth from other ethnic 2013suicide rates increased with level of M ori and Pacific people living in the most deprived areas died by suicide than M ori and Pacific people living in less deprived and Other people suicide rates do not increase with level of and trends over time0%20%40%60%80%100%Percentage of suicide deaths by age and
3 Ethnicity 2013M oriPacificAsianEuropean and OtherSuicide rates among M ori and Pacific peoples decrease with age whereas suicide rates among European and Other people do ori youth have higher suicide ratesthan youth from other ethnic suicide death rate (per 100,000) 1948 deaths per 100,000 in 1998 the highest suicide rate since records 27% decrease in suicide rates since 10% decrease in suicide rates between 2006 and rates for males have changed more over time than suicide rates for locationBay of Plenty, Lakes, MidCentraland South Canterbury DHB regions have significantly higher suicide rates than the national average.
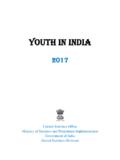
4 Waitemata, Auckland and Capital & Coast DHB regions have significantly lower suicide rates than the national is little difference in rates of urban and rural suicide , for each life-stage differences are not statistically 2425 4445 6465+Age-group (years)UrbanRuralRate (per 100,000)Rate of suicide , by urban/rural profile and life-stage age group, 20134 Significantly lower suicide rateSignificantly higher suicide rate010203040 Republic of KoreaHungarySloveniaEstoniaJapanPolandFi nlandBelgiumCzech RepublicFranceChileAustriaUSAS lovakiaIrelandIcelandNew ZealandCanadaSwedenSwitzerlandAustraliaG ermanyNorwayDenmarkLuxembourgNetherlands PortugalUnited KingdomIsraelSpainItalyMexicoGreeceTurke yTotal suicide rates per 100.
5 000 in the OECD for males and femalesFemaleMale010203040 FinlandNew ZealandIrelandChileJapanSloveniaPolandEs toniaUSAR epublic of KoreaCanadaBelgiumAustraliaCzech RepublicSwedenNorwayHungaryAustriaSlovak iaMexicoSwitzerlandFranceGermanyIcelandN etherlandsUnited KingdomDenmarkIsraelLuxembourgItalySpain GreeceTurkeyPortugalTotal youth suicide rates per 100,000 in the OECD for males and femalesFemaleMaleInternational comparisonsCompared with other countries in the OECD, New Zealand s suicide rates (males and females) are towards the middle of the Zealand s male youth suicide rate was the third highest and New Zealand s female youth suicide rate was the *in the year preceding deathSuicide deaths 2008-2013 by GP service use*Male YesMale NoFemale YesFemale NoHealth service use0%20%40%60%80%100%YesNo*in the year preceding deathSuicide deaths and GP service use* by ethnicityMaoriPacificAsianEuropean and Other0%20%40%60%80%100%20082009201020112 0122013*in the year preceding deathSuicide deaths 2008-2013 by self harm hospitalisation*Male YesMale NoFemale YesFemale
6 NoAround 20% of people who died by suicide did not use a GP servicein the year before they menwho died by suicide did not use a GP servicein the year before they diedAround 30% of people who died by suicide were hospitalised for self harm in the year before they womenwho died by suicide were hospitalised for self harm before they 82% of European and Other people who died by suicide used a GP servicein the year before they , M ori and Pacific peoplewho died by suicide were less likely to use a GP service in the year before they died6 Mental Health service use0%20%40%60%80%100%2008200920102011201 22013*in the year preceding deathSuicide deaths 2008-2013 by acute mental Health service use*Male YesMale NoFemale YesFemale No0%20%40%60%80%100%YesNo*in the year preceding deathSuicide deaths and acute mental Health service use* by ethnicityMaoriPacificAsianEuropean and OtherPacific people were less likely to have accessed mental Health services than people from other ethnic groups
7 In the year before they died by average 40% of people who died by suicide accessed mental Health servicesin the year before they of suicide deathHanging, strangulation and suffocation (X70)Firearms and explosives (X72, X74-5)Poisoning - gases and vapours (X66-7)Poisoning - solids and liquids (X60-5, X68-9)Submersion (drowning) (X71)Other means (X76-84)0%20%40%60%80%100%AsianMaoriOthe rPacificMethod of suicide death by ethnicityHanging, strangulation and suffocation (X70)Firearms and explosives (X72, X74-5)Poisoning - gases and vapours (X66-7)Poisoning - solids and liquids (X60-5, X68-9)Submersion (drowning) (X71)Other means (X76-84)MethodHanging, strangulation and suffocation is the most common females use poisoning by solids and liquidsas a method than males use firearms and explosivesas a method than ori, Pacific and Asian people use hanging, strangulation and suffocation as a method more than European and Other peopleMore European and Other people use firearms and explosives, and poisoning as a method than people from other ethnic groups8