Transcription of An Overview of the Economic Outlook: 2021 to 2031
1 Notes: Unless this report indicates otherwise, all years referred to are calendar years. Federal fiscal years run from October 1 to September 30 and are designated by the calendar year in which they end. Numbers in the text and tables may not add up to totals because of | 2021An Overview of the Economic Outlook: 2021 to 2031 The 2020 2021 coronavirus pandemic caused severe Economic disruptions last year as households, governments, and busi-nesses adopted a variety of mandatory and voluntary measures collectively referred to here as social distancing to limit in-person interactions that could spread the virus. The impact was focused on particular sectors of the economy, such as travel and hospitality, and job losses were concentrated among lower-wage workers. Over the course of the coming year, vaccination is expected to greatly reduce the number of new cases of COVID-19, the disease caused by the coronavirus. As a result, the extent of social distancing is expected to decline.
2 In its new Economic forecast, which covers the period from 2021 to 2031, the congressional budget office therefore projects that the Economic expansion that began in mid-2020 will continue (see Table 1). Specifically, real (inflation-adjusted) gross domestic product (GDP) is projected to return to its prepandemic level in mid-2021 and to surpass its potential (that is, its maximum sustainable) level in early 2025. In CBO s projections, the unemployment rate gradually declines through 2026, and the number of people employed returns to its prepandemic level in is using this Economic forecast as the basis for updating its budget projections for 2021 to 2031. The agency plans to release those budget projections later in February and a more detailed report about this forecast later this winter. The forecast incorporates Economic and other information available as of January 12, 2021, as well as estimates of the Economic effects of all legislation (including pandemic-related legislation) enacted up to that Economic Outlook for 2021 to 2025In CBO s projections, which incorporate the assump-tions that current laws governing federal taxes and spending (as of January 12) generally remain in place and that no significant additional emergency funding or aid is provided, the economy continues to strengthen during the next five years.
3 Real GDP expands rapidly over the coming year, reaching its previous peak in mid-2021 and surpassing its potential level in early 2025. The annual growth of real GDP averages percent during the five-year period, exceeding the percent growth rate of real potential GDP (see Figure 1). Labor market conditions continue to improve. As the economy expands, many people rejoin the civilian labor force who had left it during the pandemic, restoring it to its prepandemic size in The unemployment rate gradually declines throughout the period, and the number of people employed returns to its prepandemic level in 2024. Inflation, as measured by the price index for personal consumption expenditures, rises gradually over the next few years and rises above percent after 2023, as the Federal Reserve maintains low interest rates and continues to purchase long-term securities. Interest rates on federal borrowing rise. The Federal Reserve maintains the federal funds rate (the rate that financial institutions charge each other for overnight loans of their monetary reserves) near zero through mid-2024 and then starts to raise that rate gradually.
4 The interest rate on 3-month Treasury bills closely 1. The labor force is the number of people age 16 or older in the civilian noninstitutionalized population who have jobs or who are available for work and are actively seeking Overview OF THE Economic OUTLOOK: 2021 TO 2031 FEbRUARy 2021 Table 1 .CBO s Economic Projections for Calendar Years 2021 to 2031 Annual Average20202021202220232024 20252026 2031 Percentage Change From Fourth Quarter to Fourth QuarterGross Domestic ProductReal price PCE price index price index consumer price index price Cost Index Level (Percent)Unemployment fPercentage Change From Year to YearGross Domestic ProductReal price PCE price index price index consumer price index price Cost Index AverageUnemployment Rate (Percent) Force Participation Rate (Percent) Employment (Monthly change, in thousands) h-76552114514513540 Interest Rates (Percent)Three-month Treasury Treasury Bases (Percentage of GDP)Wages and corporate profits Account Balance (Percentage of GDP) sources: congressional budget office ; bureau of Economic Analysis; bureau of Labor Statistics; Federal Reserve.
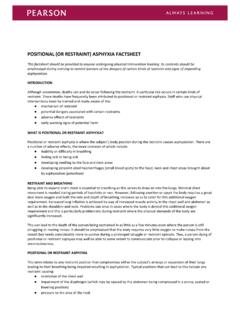
5 See # = gross domestic product; PCE = personal consumption Real values are nominal values that have been adjusted to remove the effects of changes in Excludes prices for food and The consumer price index for all urban The employment cost index for wages and salaries of workers in private Value for the fourth quarter of Value for the fourth quarter of The labor force participation rate is the share of the civilian noninstitutionalized population age 16 or older that is working or actively seeking The average monthly change in the number of employees on nonfarm payrolls, calculated by dividing the change from the fourth quarter of one calendar year to the fourth quarter of the next by Adjusted to remove distortions in depreciation allowances caused by tax rules and to exclude the effects of changes in prices on the value of Estimated value for Represents net exports of goods and services, net capital income, and net transfer payments between the United States and the rest of the 2021 AN Overview OF THE Economic OUTLOOK: 2021 TO 2031 Figure 1.
6 The Relationship Between GDP and Potential GDP 3036 6 4 2022000200520102015202020252030200020052 0102015202020252030 Real GDP GrowthReal Potential GDP GrowthOutput GapPercentage of Potential GDPP ercentage Change ProjectedData sources: congressional budget office ; bureau of Economic Analysis. See # values are nominal values that have been adjusted to remove the effects of changes in prices. Potential GDP is CbO s estimate of the maximum sustainable output of the economy. Growth of real GDP and of real potential GDP is measured from the fourth quarter of one calendar year to the fourth quarter of the output gap is the difference between GDP and potential GDP, expressed as a percentage of potential GDP. A positive value indicates that GDP exceeds potential GDP; a negative value indicates that GDP falls short of potential GDP. Values for the output gap are for the fourth quarter of each shaded vertical bars indicate periods of recession, which extend from the peak of a business cycle to its trough.
7 The National bureau of Economic Research (NbER) has determined that an expansion ended and a recession began in February 2020. Although the NbER has not yet identified the end of that recession, CbO estimates that it ended in the second quarter of = gross domestic CBO s projections, the annual growth of real (inflation-adjusted) GDP exceeds that of real potential GDP until 2026 and then falls below it. The output gap between real GDP and real potential GDP is positive for several years, starting in 2025, before moving back toward its historical Overview OF THE Economic OUTLOOK: 2021 TO 2031 FEbRUARy 2021follows the federal funds rate. The interest rate on 10-year Treasury notes rises gradually as the Federal Reserve reduces the pace of its asset purchases and investors anticipate rising short-term interest rates later in the s projections of Economic growth have been boosted by various laws enacted in Most recently, in late December, the Consolidated Appropriations Act, 2021 (Public Law 116-260), appropriated funds for the remainder of fiscal year 2021, provided additional emergency funding for federal agencies to respond to the public health emergency created by the pandemic, and provided financial support to households, businesses, and nonfederal governments affected by the Economic downturn, among other measures.
8 CBO estimates that the pandemic-related provisions in that legislation will add $774 billion to the deficit in fiscal year 2021 and $98 billion in Those provisions will boost the level of real GDP by percent, on average, in calendar years 2021 and 2022, CBO estimates; the bulk of the impact will occur in Economic Outlook for 2026 to 2031In CBO s projections, the economy continues to expand from 2026 to 2031. Real GDP grows by percent per year, on average (see Table 2). Real potential GDP grows slightly more rapidly (see Table 3). For most of the period, the Federal Reserve allows inflation to remain above its target level; the level of real GDP likewise remains above the level of real potential GDP for several years. Eventually, less accommodative policies on the part of the Federal Reserve help push GDP back toward its historical average relationship with potential GDP. A mild increase in productivity growth causes poten-tial output in CBO s projections to grow more quickly over the 2021 2031 period than it has grown since the 2007 2009 recession.
9 However, potential output still grows more slowly than it has grown since 1950, mainly 2. See congressional budget office , The Effects of Pandemic-Related Legislation on Output (September 2020), Those provisions are contained in divisions M, N, and EE of the Consolidated Appropriations Act, of an ongoing, long-term slowdown in the growth of the labor in the Economic OutlookCBO s projections reflect an average of possible out-comes under current law. But these projections are subject to an unusually high degree of uncertainty, and that uncertainty stems from many sources, including the course of the pandemic, the effectiveness of monetary and fiscal policies, and the response of global financial markets to substantial increases in public deficits and debt. As a result, the economy could expand substantially more quickly or more slowly than CBO projects. Labor market conditions could likewise improve more quickly or slowly than projected, and inflation and interest rates could rise more rapidly or slowly as well.
10 Also uncertain is the impact of the pandemic on the economy over the longer term, including its effects on productivity, the labor force, and technological With Previous ProjectionsCBO currently projects a stronger economy than it did in July 2020, in large part because the downturn was not as severe as expected and because the first stage of the recovery took place sooner and was stronger than expected (see Table 4 on page 7).4 GDP and employ-ment are projected to be higher and to be accompa-nied by modestly higher inflation and higher interest rates than they were in CBO s July projections. The fact that the downturn was less severe and the recovery stronger than previously projected also changed the projected pattern of growth: CBO s current projec-tions of GDP growth are stronger, on average, for the 2021 2025 period than they were in July but weaker for the 2026 2031 made those changes to its Economic projections even though it expects social distancing to be more pro-nounced and to last longer than projected in July.