Transcription of Analysis of Covariance (ANCOVA) in R (draft)
1 Analysis of Covariance ( ancova ) in R (draft)Francis HuangAugust13th,2014 IntroductionThis short guide shows how to use our SPSS class example and getthe same results in R. We introduce the new variable the covariateor the concomitant variable. We would like to control or account forthis third variable (a continuous variable) and if all goes well, we getbetter results. We ll need to install a few packages, namely:rio,car,multcomp,effects,psych. NOTE: don t need to reinstall if you vealready installed. You must call them using s first get our data1, in R.
2 You ll need theriopackage to1 ~huangf/data/ the SPSS file. After importing our data, convert group into afactor with the appropriate (digits = 3)library(rio)x <-import(" ~huangf/data/ ")str(x)## : 12 obs. of 3 variables:## $ group :Class labelled atomic [1:12] 1 1 1 1 1 1 2 2 2 2 ..## ..- attr(*, "labels")= Named num [1:2] 1 2## ..- attr(*, "names")= chr [1:2] "Trad" "New Method"## $ quiz : num 1 2 3 4 5 6 1 2 4 5 ..## $ aptitude: num 4 3 5 6 7 9 1 3 2 4 ..x$group <-factor(x$group, label =c("Trad", "New Method"))str(x)## : 12 obs.
3 Of 3 variables:## $ group : Factor w/ 2 levels "Trad","New Method": 1 1 1 1 1 1 2 2 2 2 ..## $ quiz : num 1 2 3 4 5 6 1 2 4 5 ..## $ aptitude: num 4 3 5 6 7 9 1 3 2 4 ..table(x$group)#### Trad New Method## 6 6analysis of Covariance (ANCOVA) in r (draft) 2 Assumption checkingNow we want to compare some assumptions (see the textbook).Assumption1: equality of slopes interaction is not significiant,testing the equality of slopes that the covariate is associated with theoutcome the same way between groups we are just interested in theinteraction term <-aov(quiz ~ group + aptitude + group:aptitude,data = x)summary(res1)## Df Sum Sq Mean Sq F value## group 1 ## aptitude 1 ## group.
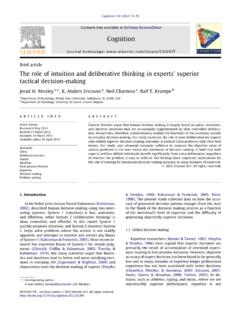
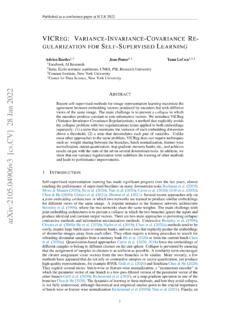
4 Aptitude 1 ## Residuals 8 ## Pr(>F)## group ## aptitude **## group:aptitude ## Residuals## ---## Signif. codes:## 0 ** ** * . 1 Assumption2: linearity of slopes. Here, we are eyeballing theslopes or the trend lines between the two groups. They look roughlyequal (not, we can have more formal tests for this)plot(x$aptitude, x$quiz, col = x$group, xlab = "Aptitude",ylab = "Quiz")Assumption3: Equality of the two groups on the covariate. Justrun a t-test and show that two groups are not different on the co-variate.
5 If more than two groups, of course you can run an below show no statistically significant (aptitude ~ group, data = x)#### Welch Two Sample t-test#### data: aptitude by group## t = 2, df = 10, p-value = ## alternative hypothesis: true difference in means is not equal to 0## 95 percent confidence interval: Analysis of Covariance (ANCOVA) in r (draft) 32468135 AptitudeQuizanalysis of Covariance (ANCOVA) in r (draft) 4## ## sample estimates:## mean in group Trad## ## mean in group New Method## : Homogeneity of variance.
6 We ve already discussedthis before. To get this, run2:2 Install thecarpackage first to Includingthecenter=meanoption gives the sameresult as SPSS library(car)leveneTest(quiz ~ group, center = mean, data = x)## Levene s Test for Homogeneity of Variance (center = mean)## Df F value Pr(>F)## group 1 ## 10 HOV is the actual ANCOVAWhen running an ancova , order matters. You want to remove theeffect of the covariate first that is, you want to control for it prior toentering your main variable or you do not do this in order, you willget different results!
7 Res1 <-aov(quiz ~ aptitude + group, data = x)# NOTE: covariate goes first!! NOTE: there is# no interactionsummary(res1)## Df Sum Sq Mean Sq F value Pr(>F)## aptitude 1 ## group 1 ## Residuals 9 #### aptitude**## group**## Residuals## ---## Signif. codes:## 0 ** ** * . 1 TukeyHSD(res1)#does not produce correct differences!## Warning in replications(paste("~", xx), data## = mf): non-factors ignored: aptitudeanalysis of Covariance (ANCOVA) in r (draft) 5## Warning in (res1): which ## specified some non-factors which will be## dropped## Tukey multiple comparisons of means## 95% family-wise confidence level#### Fit: aov(formula = quiz ~ aptitude + group, data = x)#### $group## diff lwr upr p adj## New Method-Trad # You can check for normality here because we# need the residuals of the actual model.
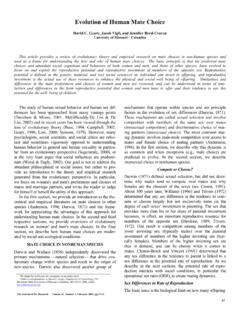
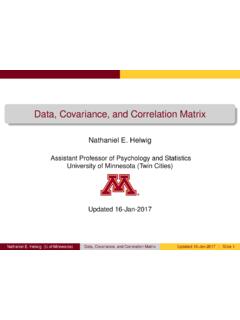
8 To# get the residuals, just use the resid# functionresiduals <-resid(res1)residuals## 1 2 3 4 5## ## 6 7 8 9 10## ## 11 12## (residuals)#### Shapiro-Wilk normality test#### data: residuals## W = 1, p-value = # library(e1071) #this contains the skew# function skew(residuals) skew(x$quiz)hist(residuals)# all points to normality being met# to get the real p value and difference,library(multcomp)## Loading required package: mvtnorm## Loading required package: survival## Loading required package: of Covariance (ANCOVA) in r (draft) 6 Histogram of residualsresidualsFrequency # uses the general linear hypothesis functionposthoc <-glht(res1, linfct =mcp(group = "Tukey"))# looks odd-- uses the glht function.
9 Just# replace the output object (res1), the# grouping variable (group)summary(posthoc)#### Simultaneous Tests for General Linear Hypotheses#### Multiple Comparisons of Means: Tukey Contrasts###### Fit: aov(formula = quiz ~ aptitude + group, data = x)#### Linear Hypotheses:## Estimate Std. Error## New Method - Trad == 0 ## t value Pr(>|t|)## New Method - Trad == 0 **## ---## Signif. codes:## 0 ** ** * . 1## (Adjusted p values reported -- single-step method)confint(posthoc)#### Simultaneous Confidence Intervals## Analysis of Covariance (ANCOVA) in r (draft) 7## Multiple Comparisons of Means: Tukey Contrasts###### Fit: aov(formula = quiz ~ aptitude + group, data = x)#### Quantile = ## 95% family-wise confidence level###### Linear Hypotheses:## Estimate lwr upr## New Method - Trad == 0 : you want to see the means by group (unadjusted):library(psych)#adds describBy#### Attaching package.
10 Psych #### The following object is masked from package:car :#### logit# if you get an error, that means you have to# install the package first# ( psych )describeBy(x$quiz, x$group)## group: Trad## vars n mean sd median trimmed mad min## 1 1 6 1## max range skew kurtosis se## 1 6 5 0 ## ---------------------------------## group: New Method## vars n mean sd median trimmed mad min## 1 1 6 4 4 1## max range skew kurtosis se## 1 6 5 get theadjustedgroup means adjusted for the covariate, needto use theeffectspackage.