Transcription of Analysis of Total Petroleum Hydrocarbons in Environmental ...
1 Analysis of Total Petroleum Hydrocarbons in Environmental samples Using Ultra-Fast Gas Chromatography Application Note Author Abstract James D. McCurry, An ultra-fast gas chromatography (UFGC) method was developed for the Agilent Technologies, Inc. determination of Total Petroleum Hydrocarbons in Environmental samples . A. three-minute Analysis time was achieved by a using short, thin film capillary column, fast column heating ramps, and high carrier gas flows. This method was demonstrated to meet all performance criteria outlined by the ISO 16703 method. In addition to short Analysis times, this UFGC method provided highly accurate and precise results. This was demonstrated by preparing and analyzing certified reference soil and river sediment samples containing two different amounts of TPH contamination. Introduction Experimental To facilitate the sample preparation, a kit is available from Sigma-Aldrich Company Gas chromatography (GC) is the Sample preparation containing all components needed for the preferred technique for the quantitative For this work, a TPH-contaminated soil ISO 16703 procedure (p/n 56681-1KT-F)2.
2 Analysis of Total Petroleum hydrocarbon (TPH) contamination in water, soil, sample (BAM-U021) and river sediment and sediments. A number of methods sample (BAM-U022) were obtained from Ultra-fast gas chromatography have been developed to standardize the Bundesanstalt f r Materialforschung An Agilent Intuvo 9000 Series Gas this Analysis within each regulatory und pr fung in Germany. A consensus Chromatograph was configured as geography. One widely used method value of the TPH content for each sample follows: is ISO 16703, which is designed is published along with an uncertainty to measure saturated, cyclic, and measure for those values. Split/splitless inlet aromatic Hydrocarbons with carbon Each sample was prepared in duplicate Agilent Focus Liner, tapered, numbers between n-decane (C10H22). using the extraction and cleanup deactivated with glass wool and tetracontane (C40H82)1. This method procedure described in the ISO 16703 (p/n 210-4022-5).
3 Excludes the Analysis of polyclyclic method: aromatic Hydrocarbons (PAH), which are removed from the sample using a Agilent Intuvo 9000 Guard Chip Fifteen grams of sample were multistep sample preparation protocol. ultrasonically extracted with The chromatographic Analysis of the Single detector Intuvo Flow acetone and a retention time Technology flow path Hydrocarbons does not require speciation of individual compounds or classes of window (RTW) standard solution compounds. Rather, the peaks are eluted (C10 and C40 dissolved in Agilent DB-5ht column, from the column as an unresolved hump. heptane). 5 m mm, m film This aspect makes the Analysis suitable for ultra-fast gas chromatography (UFGC), Sample extracts were centrifuged Flame ionization detector where short columns are combined with to remove fine particles. fast oven programming and high carrier Agilent 7693 Automated Liquid gas flows to reduce Analysis time. UFGC The clear extracts were washed Sampler (ALS) with 10 L syringe is particularly attractive to contract twice with 100 mL of water.
4 Table 1 shows the operating conditions laboratories trying to maximize sample The organic layer was collected for the instrument. throughput and minimize turn-around time. and dried with sodium sulfate. The Agilent Intuvo 9000 Gas Ten milliliters of dry organic extract Chromatograph is designed with UFGC in was cleaned with an SPE cartridge mind. The unique direct column heating containing activated Florisil. technology eliminates the traditional air-bath column oven, and provides Table 1. Instrument conditions. 250 C/min column heating rates from 40 C to 350 C. When using rapid column Parameter Value heating, high column flows must be Inlet Splitless at 350 C. precisely maintained to ensure excellent Injection volume L. retention time repeatability from run to run. Synergy between the column Constant column flow 10 mL/min helium heating and flow is accomplished on the Column temperature program 40 C for minutes Intuvo 9000 GC with the 6th generation 250 C/min to 350 C.
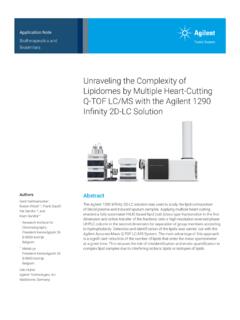
5 350 C for minutes electronic pneumatics control (EPC). inlet module. This Application Note Intuvo flow path Guard chip: track oven mode presents an UFGC method for TPH Bus: default (350 C). Analysis translated from ISO 16703. This Detector Flame ionization at 350 C. UFGC approach meets the performance benchmarks set by the ISO 16703 method. 2. Before proceeding with the calibration pA Heptane and Analysis , a suitability test was C16 C18 C20 C22. performed by injecting a heptane solution 3,000 C12 C24. C26 C30C32. containing 50 mg/mL of even numbered C10 C14 C28 C34. normal alkanes from C10H22 to C40H82. 2,500 C36. C38. This test verified the GC system's C40. performance for resolution, recovery, and 2,000. response. A six-level calibration from mg/mL to mg/mL was done 1,500. using standards containing two different types of mineral oil. The third calibration 1,000. standard (1 mg/mL mineral oil) served as the control solution for the repeatability 500.
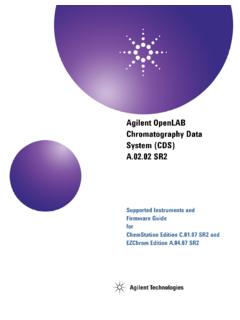
6 Test. After calibration, the extracts of each sample duplicate were analyzed 0. five times to measure the precision and min accuracy. Figure 1. Separation of Hydrocarbons using an Agilent Intuvo 9000 GC. Results and Discussion Table 1. Recovery of C10 to C40 Hydrocarbons in Table 2. Results of the ISO 16703 calibration Figure 1 and Table 1 show the results the TPH performance mixture. repeatability test. of the system suitability test. The Peak area recovery Run Standard 3 peak area decane peak is well-separated from the heptane solvent front, and each C10 861 1 18,044. n-alkane in the mixture is baseline C12 867 2 17,644. resolved. The response of tetracontane C14 877 3 18,236. (C40) was measured at with respect C16 890 Mean 17,975. to the eicosane (C20) response. This C18 875 Std dev value exceeds the method lower limit C20* 882 RSD %. of , indicating excellent system C22 882 performance with respect to boiling point discrimination. C24 882 C26 873 Figure 2 shows the calibration C30 867 performance.
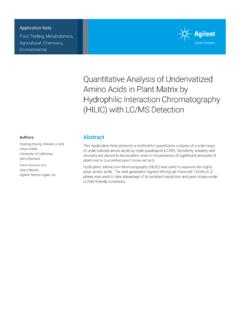
7 The correlation coefficient C34 859 of indicates a good linear fit C36 853 across the full calibration range. A. C38 829 calibration repeatability test was done by measuring the detector response of C40 817 three sequential injections of calibration standard 3 (1 mg/mL). Table 2 shows the results. The measured relative standard 140,000 Peak area = *Amt + R 2 = deviation (RSD) of % was below the 120,000. 6. required maximum of 5 % RSD. 100,000. 80,000. Area 60,000 5. 40,000 4. 3. 20,000. 1 2. 0. 0 2 4 6 8. Amount (mg/mL). Figure 2. A six-level linear calibration from mg/mL to 8 mg/mL TPH. 3. Figure 3 shows a chromatographic overlay duplicates, each run has nearly identical important that these two marker peaks from five injections of each BAM-U021 chromatographic response and retention exhibit high retention time precision since soil duplicate (10 injections Total ). The times. The two inset chromatograms offer they set the integration start and end GC Analysis for a single sample run was detailed views of the C10 and C40 marker times for determining TPH response.
8 The completed in about 3 minutes using peaks. The C10 peak had a retention time Analysis of the BAM-U022 river sediment ultra-fast GC conditions. The C10 and range of only minutes, while the sample is shown in Figure 4. This C44 peaks were added to the sample C40 peak retention time range was even sample contains a larger amount of TPH. to serve as integration markers for the lower, at minutes. The statistical compared to the soil sample. Total TPH sample response, as shown by Analysis for each peak's retention time is the dashed baseline. For these sample shown in the inset table in Figure 3. It is pA. 1,400. pA. pA 1,000. 2,250. 1,200 600. 2,000 800. min 1,750 400. C40. 0. 1,500. min 1,250. C10. 1,000. Retention time (min). 750. C10 C40. Avg 500. Std dev 250 RSD % %. 0. min Figure 3. An overlay of 10 chromatograms obtained from duplicate analyses of the BAM-U021 soil sample. The inset chromatograms and the table show the retention time precisions for the C10 and C40 marker peaks.
9 PA. 6,000 BAM-U022. Certified Reference Sample Mineral oil-contaminated sediment 5,000. 4,000. 3,000. 2,000 C40. C10. 1,000 TPH. 0. 0 min Figure 4. Ultrafast GC Analysis of TPH in a contaminated river sediment sample. 4. Table 3 shows the quantitative results for Table 3. Calibration repeatability results obtained from three sequential injections of standard 3. each sample. Three Analysis performance (1 mg/mL). measures are demonstrated using this data. First, the method accuracy is shown Run U021 A (mg/kg) U021 B (mg/kg) U022 A (mg/kg) U022 B (mg/kg). by comparing the measured TPH contents 1 3,462 3,480 8,701 8,630. to the certified values published by 2 3,487 3,485 8,724 8,658. BAM. The amount of TPH measured in 3 3,502 3,482 8,656 8,610. each sample's duplicate Analysis agrees with the certified value, well within the 4 3,513 3,479 8,736 8,732. accepted errors. Next, overall instrument 5 3,538 3,492 8,728 8,606. precision is shown using the calculated Mean 3,500 3,484 8,709 8,647.
10 RSDs from the analyses results. Five runs Cert. value 3,560 260 8,270 550. of each sample's duplicates were shown Std dev to have RSDs of less than 1 %. Finally, RSD % % % %. overall method precision is measured r (exp) 59 126. from the duplicate Analysis results r* (ref) 136 337. using the single lab repeatability (r) test described in the ISO 16703 method. For the BAM-U021 soil sample, the experimental repeatability of 59 mg/kg is well below the required maximum value of 139 mg/kg. Likewise, the repeatability test for the BAM-U022 river sediment sample is 126 mg/kg, well below the maximum value of 337 mg/kg required by the method. 5. Conclusion References An ultra-fast GC method was developed 1. Soil Quality-Determination of content for the Analysis of TPH in Environmental of hydrocarbon in the range C10. samples . to C40 by gas chromatography. ISO 16703:2004(E). Geneva, The UFGC method completes Switzerland: ISO. a TPH sample run in 3 minutes using short columns, fast oven 2.