Transcription of ANalysis Of VAriance II - Ilvento
1 ANalysis Of VAriance IIDr Tom IlventoDepartment of Food and Resource EconomicsOverview Let s continue our discussion of the ANOVA Model We will solve for the sum of squares for a basic model with two means See how software displays the results We will look at the Basic Test for ANOVA F-test Based on the F-distribution Give an example of more that two means2 Let s get started with a problem A study was done to examine at how Intrinsic versus Extrinsic Motivation influences Creativity Art for art s sake; money for God s sake! Students who were experienced in creative writing were randomly assigned to two groups Intrinsic motivation - motivation to be creative from within Extrinsic motivation - motivation based on external reasons Motivation was supplied by a survey mechanism - they were asked to rank motivational questions in one of two areas Later they were asked to write a poem and it was judged by a panel of 12 judges on a 40 point scale Does the type of motivation influence creativity?
2 3 Let s look at the data What do you see? Somewhat normal distribution A few outliers, but not too bad The mean score was ; the median is The CV is ; a moderate amount of DevStd Err Meanupper 95% Meanlower 95% MeanNSum WgtSumVarianceSkewnessKurtosisCVN 30 2 27 2444 2222233 200011111 1888999999 1777777 1455 1222223 11 0 06 055 Count1136896361120|5 represents 5 Stem and LeafSCORELet s compare the means We have everything we need to conduct a test of the two means Ho: i - e = 0 Ha: i - e ! 95% 95%Means and Std DeviationsOneway ANalysis of SCORE By TREATMENTD ifference of Means Hypothesis Test Ho: Ha: Test Statistic Rejection Region p-value Conclusion: 6t-Test: Two-Sample Assuming Equal Mean Difference0df45t (T<=t) Critical (T<=t) Critical 1- 2=0 1- 2!0 .01 RejectANOVA Output for the same problem ANOVA output would typically give the means and variances of each group And then the ANOVA table, which is the breakdown of the Sums of Squares, and the Mean Squares (SS/df)7t-Test: Two-Sample Assuming Equal Mean Difference0df45t (T<=t) Critical (T<=t) Critical : Single of VariationSSdfMSFP-valueF critBetween *Prob > FAnalysis of VarianceHow does ANOVA work?
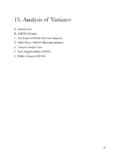
3 We decompose the Total Sum of Squares Part due to Treatment or Between Factor Levels Part due to Error or Within each Factor Level We compute the variability of the treatment means from the Grand Mean (the mean from the whole sample, , all groups) Sum of Squares for Treatments (SST) Which measures Between Factor Level variation And the variability within the treatment levels Sum of Squares for Error (SSE) Which measures within each Factor Level variation8 How does ANOVA work? We adjust SST and SSE to reflect a mean sum of squares divide by degrees of freedom Then we compare to see if the Mean Sum of Squares for Treatments (MST) is larger relative to the Mean Sum of Squares for Error (MSE) We do this by taking a ratio of the two sources of sums of squares9 MSEMSTF=*How does ANOVA work? We ask, Is there more variability across the means for the factor levels (or treatments), than collectively within each of the Factor Levels? We look to see if there is more variability across factor levels (treatments), with respect to a probability framework using an F-distribution with specified degrees of freedom If yes, we will conclude that the factors influence the response variable there are differences in the means between Factor Levels In the case of the single Factor, 2 levels, the result is identical to a difference of means test10 Decomposing the Total Sums of Squares for a one-Factor Model11!
4 Y ! y kLet k = # treatmentskThe Grand Mean isEach group mean isThe sample size for each factor levelnkDegrees of FreedomTotal Sum of Squaresn-1 Sum of Squares for Treatmentk-1 Sum of Squares for Errorn-kThe degrees of freedome should add up SSTotal = SST + SSE Degrees of freedom n-1 = (k-1) + (n-k) n = 100 k=3 100-1 = (3-1) + (100-3) 99 = 2 + 9712 Formulas for the Sums of Squares Total Sum of Squares (n-1 ) If I divided by the degrees of freedom, I would have the sample VAriance Sum of Squares for Treatments (k-1 ) Dividing by the degrees of freedom gives the Mean Square for Treatment, MST = SST/(k-1) Sum of Squares for Error (n-k ) Another way to calculate this is: Dividing by degrees of freedom gives the Mean Square Error, MSE = SSE/(n-k)13! SSTotal=(yi"Y )2i=1n#!"==kiiiYynSST12)(SSE=(y1j!y 1)2j=1n1"+(y2j!y 1)2j=1n2"+..(ykj!y k)2j=1nk"SSE=(n1!1)s12+(n2!1)s22+..(nk!1 )sk2 Let s Work through the computations for the Creativity Example14 IntrinsicExtrinsicSample sizen1=24n2= from Grand = !
5 "==kiiiYynSST12)(SST = 24( )2 + 23( )2 SST = 24( )2 + 23( )2 SST = + = (n1!1)s12+(n2!1)s22 SSE = 23( ) + 22( )SSE = + = = SST + SSE = + = = = = (47-2) = Output Our values are similar except for rounding error SST = SSE = RsquareRoot Mean Square ErrorMean of ResponseObservations (or Sum Wgts) of FitINTRINSIC-EXTRINSICA ssuming equal variancesDi!erenceStd Err DifUpper CL DifLower CL RatioDFProb > |t|Prob > tProb < * * TestTREATMENTE rrorC. *Prob > FAnalysis of VarianceOneway AnovaOneway ANalysis of SCORE By TREATMENTF-Test An F* is the ratio of two variances Between treatments Within treatments An F* = 1 mean equality of variances and that is the Null Hypothesis for our test16! F*=MSTMSE! F*= Distribution The F-distribution is a positively skewed distribution with two degrees of freedom the numerator and the denominator We compare our F* to a F distribution at a specified ", with v1 and v2 degrees of freedom v1 represents the degrees of freedom for the numerator (k-1) v2 represents the degrees of freedom for the denominator (n-k) The table will give the critical value to compare with " F-tests are always one-tailed tests17F-table of critical values for !
6 = .05 For each level of (.10, .05, .01) there is a different F-table with Degrees of freedom for the numerator and denominator The numerator degrees of freedom have less options (k-1) What would be the F critical value value for 2 and 18 Tables This table is best for regression & ANOVA tests were tend to be smallAlpha of Freedom Hypothesis Test for Creativity Data Ho: Ha: Assumptions Test Statistic Rejection Region Conclusion: 19Ho: 1 = 2 = .. kHa: At least two means are different Equal variances, normal distributionF* = p =. , 1, 45 = F* > , 1, 45or p < .01 Reject Ho: 1 = 2 = .. kLet s revisit the Output Excel s output includes Means and VAriance ANOVA Table JMP gives more20A note about a Difference of Means Test and the ANOVA Test t* from difference of means test = F* = In case of comparing just two means, if you square t*, it roughly equals F* The two tests (t-test and F-test for ANOVA) result in the same conclusion The advantage of ANOVA is that you can compare and make inferences on more than two means21 More than two means: Coupon Example A greeting company wanted to use a coupon offer to increase sales They developed four different coupon designs, and used each design with a number of customers They took a sample of 8 customers for each design and noted their purchase amount as a result of the coupon Did the coupons have different effects on sales?
7 22 CustomerDesign1 Design 2 Design 3 Design 41$ $ $ $ $ $ $ $ $ $ $ $ $ $ $ $ $ $ $ $ $ $ $ $ $ $ $ $ $ $ $ $ $ $ $ $ $ $ $ $ MEAN$ Design1 Factor: Coupon Design4 Treatments8 replications per treatmentExperimental Unit: PersonMeasurement Unit: PersonTotal Sample Size: 32 Calculations The Variances are very similar - no problem with the assumptions SST = 8( )2 + 8( )2 + 8( )2 + 8( )2 SST= MST = (4-1) = SSE = (8-1) + (8-1) + (8-1) + (8-1) SSE= MSE = (32-4) = F* = = we can use the output from Excel orJMP Excel gives the means and VAriance F* = Critical Value = p-value = .3933 JMP gives more Box plot shows us the differences are small relative to the spread We cannot reject Ho:24 ANOVA Hypothesis Test for Greeting Card Data Ho: Ha: Assumptions Test Statistic Rejection Region Conclusion: 25Ho: 1 = 2 = 3 = 4 Ha: At least two means are different Equal variances, normal distributionF* = p =. , 3, 28 = F* > , 3, 28or p = .393 Cannot Reject Ho: 1 = 2 = 3 = 4 Using Excel to do an ANOVA Arrange data in columns each factor level is a column It is a good idea to label the columns Use: Tools, Data ANalysis , ANOVA: Single Factor Identify the input range of columns Alpha for the test Whether labels are present Output range I would also suggest using Data Descriptive on each column to get Factor Level statistics On the total sample to get the Grand Mean26 Summary We now know the components of the ANOVA table And how to do an F-test for the difference of the means for the treatment levels There still is more terms to learn - R-square And the strategy of what to do next should we find significant differences in the means And we will explore a few other models two factors and a block design27