Transcription of Analytical Method Validation Parameters: An Updated Review
1 Int. J. Pharm. Sci. Rev. Res., 61(2), March - April 2020; Article No. 01, Pages: 1-7 ISSN 0976 044X International Journal of Pharmaceutical Sciences Review and Research International Journal of Pharmaceutical Sciences Review and Research Available online at Copyright protected. Unauthorised republication, reproduction, distribution, dissemination and copying of this document in whole or in part is strictly prohibited. Available online at 1 Lavanya Chowdary G, Ravisankar P*, Akhil Kumar G, Mounika K, Srinivasa Babu P Department of Pharmaceutical Analysis, Vignan Pharmacy College, Vadlamudi, Guntur, , India. *Corresponding author s E-mail: Received: 08-02-2020; Revised: 22-03-2020; Accepted: 27-03-2020. ABSTRACT Analytical Method development aids to understand the critical process parameters and to minimize their influence on accuracy and precision.
2 A validated systematic approach ensures that it provides consistent, reliable, and accurate data. The parameters depicted here are according to ICH guidelines and include accuracy, precision, specificity and limit of detection, the limit of quantitation, linearity, range and robustness. Method Validation ensures that the selective Method will give reproducible, reliable, and consistent results adequate for the intended purpose. It is, therefore, necessary to define precisely both the conditions in which the procedure is to be used and the purpose for which it is intended. Method Validation is, therefore, a fundamental component of the measures that a laboratory should establish to be able to create reliable Analytical data. Keywords: Validation , precision, specificity, accuracy, ICH guidelines. INTRODUCTION nalytical Method Validation is the process of demonstrating that Analytical procedures are suitable for their intended use.
3 More specifically, Analytical Method Validation is a matter of establishing documented evidence that the specified Method will consistently provide accurate test results that evaluate a product against its defined specification and quality attributes. The Method should be validatable, transferable, robust, reliable, accurate and precise for day-to-day activities in the Quality Control environment. The Method should not enter the Validation phase unless it is fully developed. Validation experiments must be properly documented and performed on qualified and calibrated instrumentation and There are different types of formulation compositions available: Dose proportional formulation composition. Pseudo dose proportional formulation composition. Look alike formulation composition. Dose proportional formulation composition: In these types of formulations, composition of active and inactive ingredients proportionally increases as the strength increases.
4 In this case, Method Validation can be performed on any of the strengths. Pseudo Dose proportional formulation composition: In this type of formulations, composition of the active ingredient proportionally increases as the strength increases but the average weight of dosage form remains constant. The weight of constituents of the matrix is modified so as to keep constant average weight. Look like formulation composition: In these types of formulations, composition of the active ingredient proportionally increases as the strength increases but the average weight of dosage form remains constant by a minor change in weight of one of the excipient. Look alike formulation concept is applicable only for the Drug Product having less content of active ingredient. These current Validation characteristics describe the Validation parameters stated by the International Conference on Harmonization [ICH] guidelines Q2 (R1)9-11.
5 Different Types of Validation characteristics: Precision. Accuracy. Specificity. Linearity. Range. Detection Limit. Quantitation Limit. Ruggedness. Robustness. System Suitability System suitability is defined by ICH as "the checking of a system, before or during the analysis of unknowns, to ensure system performance." System suitability criteria may include such factors as plate count, tailing, retention, and/or resolution. System suitability criteria should also Analytical Method Validation Parameters: An Updated ReviewA Review Article Int. J. Pharm. Sci. Rev. Res., 61(2), March - April 2020; Article No. 01, Pages: 1-7 ISSN 0976 044X International Journal of Pharmaceutical Sciences Review and Research International Journal of Pharmaceutical Sciences Review and Research Available online at Copyright protected. Unauthorised republication, reproduction, distribution, dissemination and copying of this document in whole or in part is strictly prohibited.
6 Available online at 2 include a determination of reproducibility (%RSD) when a system suitability "sample" (a mixture of main components and expected by-products/interferences) is run. System suitability testing is an integral part of Analytical procedures. If the % RSD specification is below % five replicates are used. If the % RSD specification above %, six replicates are used. The parameters used in the system suitability tests (SST) report are as follows: The number of theoretical plates or Efficiency (N). Capacity factor (K). Separation or Relative retention ( ). Resolution (Rs). Tailing factor (T). Relative Standard Deviation (RSD). Number of theoretical plates/Efficiency (N) In a specified column, efficiency is defined as the measurement of the degree of peak dispersion and it should have the column characteristics. The efficiency is conveyed in terms of the number of theoretical plates.
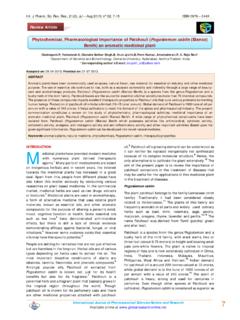
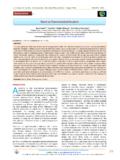
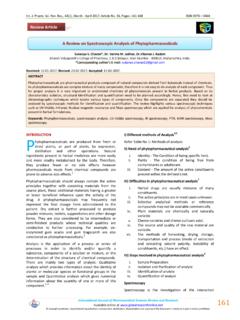
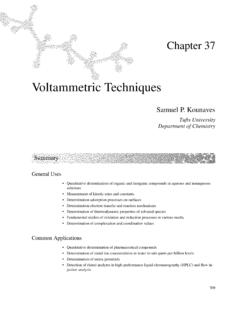
7 The formula of calculation of N is illustrated bellow in the following Figure 1. (Half height Method ). Figure 1: Half height Method relating to determination of N. N = Efficiency / Number of theoretical plates. Ve = Retention time of analyte. h = Height of the peak. w 1/2 = Gaussian function of the peak width at the half- height. 4-Sigma/tangential Method (USP Method ) With the help of signa/tangential Method N is calculated which is shown in the following figure 2 duly noting the formula for calculation of N. Figure 2: Sigma/tangential Method relating to the determination of N. N = Number of theoretical plates. Ve = elution volume, retention time or retention distance (mL, sec, or cm). h = peak height. wb = width of the peak at the base line (mL, sec, or cm). The plate number depends on column length. The theoretical plate number is the measure of column efficiency.
8 As stated by plate theory, the analyte will be in instant equilibrium with the stationary phase and the column has to be divided into the number of hypothetical plates and each plate consists of a fixed height and analyte spends finite time in the plate. Height equivalent to a theoretical plate (HETP) is given by the following formula: HETP = L/N, Where, (1) L = length of column. N = plate number. Capacity ratio or Capacity factor (k ) k =tR tMtM (2) The above said capacity factor sometimes is called as a retention factor which has no dimension and independent from the flow rate of mobile phase as well as column dimensions which is the measure of the extent of retention relating to an analyte relative to an un-retained peak. Where tR implies the retention time of the sample peak and retention time of an un-retained peak is tM. k' = 0 means no compound is left in the column.
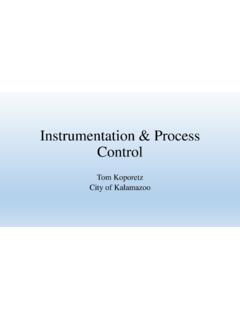
9 Generally the value of k' is > 2. Figure 3: Determination of capacity factor/ capacity ratio. Relative retention or separation factor ( ) = 2 1 (3) = Relative retention. 2 = Retention time calculated from point of injection. = Unretained peak time (Retention time (tR) of an inert component not retained by the column). 1 = the retention time from the point of injection of reference peak defined. (Suppose no reference peak is found, the value would be zero). Int. J. Pharm. Sci. Rev. Res., 61(2), March - April 2020; Article No. 01, Pages: 1-7 ISSN 0976 044X International Journal of Pharmaceutical Sciences Review and Research International Journal of Pharmaceutical Sciences Review and Research Available online at Copyright protected. Unauthorised republication, reproduction, distribution, dissemination and copying of this document in whole or in part is strictly prohibited.
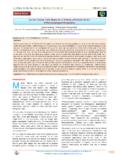
10 Available online at 3 Resolution (Rs) Resolution is the capability of the column to separate 2 drugs in 2 individual peaks or chromatographic zones and it is improved by enhancing column length, reduction of particle size and rising temperature, altering the eluent or stationary phase. It can be told in terms of the ratio of separation of the apex of two peaks by the tangential width average of the peaks. By using the following formula, the resolution is calculated. Figure 4: Determination of resolution between two peaks. tR1 and tR2 are the retention times for the two peaks of components. tw1 and tw2 = At the baseline lies between tangents drawn to the sides of the peaks. (Tangents are drawn at times the peak height). If the peaks are correctly symmetric, provided the valley between the two peaks should touch the baseline Rs is Generally good value of resolution is Rs 2 should be adequate and preferred normally.