Transcription of Analyzing Risk and Returns of Sustainable Funds
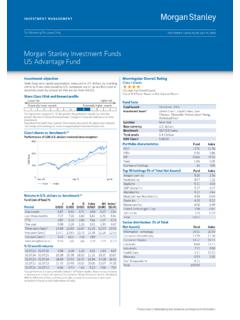
1 INSTITUTE FOR Sustainable INVESTING. Sustainable Reality Analyzing Risk and Returns of Sustainable Funds Executive Summary Can you invest sustainably without sacrificing financial Returns ? Research conducted on the performance of nearly 11,000 mutual Funds from 2004 to 2018 shows that there is no financial trade-off in the Returns of Sustainable Funds compared to traditional Funds , and they demonstrate lower downside risk. This white paper by the Morgan Stanley Institute We found that Sustainable Funds provided Returns for Sustainable Investing details the findings of in line with comparable traditional Funds while a study that compares the performance of Sustainable reducing downside risk. What's more, during Funds to traditional Funds from 2004 to 2018 using a period of extreme volatility, we saw strong Morningstar data on exchange-traded and open- statistical evidence that Sustainable Funds are ended mutual Funds active in any given year of this more stable.
2 Incorporating environmental, social, period . A total of 10,723 Funds were analyzed. We and governance (ESG) criteria into investment compared their performance on total Returns , a portfolios may help to limit market risk. measure of performance net-of-fees, and downside deviation, a measure of risk. Our findings revealed two key takeaways: The Returns of Sustainable Funds Sustainable Funds may offer lower were in line with market risk comparable ustainable Funds experienced S. traditional Funds a 20% smaller downside deviation than traditional There was no consistent Funds . This was a consistent and and statistically significant statistically significant finding. difference in total Returns . Sustainable REALIT Y. Background Sustainable investing is growing in popularity. In 2018, the Forum for Sustainable and Responsible Investment (US SIF) indicated that more than one out of every four dollars invested in the capital markets included sustainability in its investment Indeed, demand for Sustainable investments is on the rise.
3 In a 2017 survey of individual investors, the Morgan Stanley Institute for Sustainable Investing found that 75% of those surveyed are interested in Sustainable investing. 2. However, the same survey found that 53% of investors believe the return performance of Sustainable and traditional Funds that investing sustainably requires a financial trade-off. has been similar across regions, asset classes, and time periods. This perception seems to cut across generations, with 59%. While academic research is broadly settled on the finding of of millennials believing that Sustainable investing sacrifices statistically equal performance, there is an increasing collection financial performance. In line with these results, 76% of of empirical evidence that Sustainable Funds may provide asset managers surveyed by the Institute said that they investors with decreased risk compared to traditional ,11. view this perception as one of the greatest challenges to The consensus view of the research community appears to be Sustainable that Sustainable investment choices provide investors Returns What is myth and what is reality?
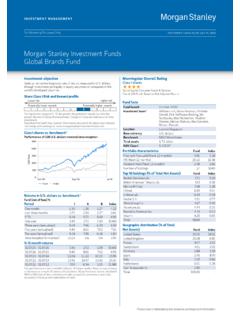
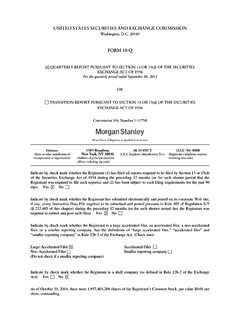
4 That are in line with those of their traditional peers, while potentially offering downside risk protection to their investors. There is a growing body of academic literature evaluating the performance of Sustainable investments in comparison to Using these previous findings as our hypotheses, we set out to traditional In the 2000s, a number of studies analyzed evaluate both return and risk performance through the end of the performance of Sustainable ,6,7,8,9 In general, 2018. This study will provide updated results on the Returns and this body of research found that from a statistical perspective, amount of risk offered by Sustainable Funds in comparison with traditional Funds . FIGURE 1. The number of ESG Focus Funds has grown 144% since 2004: 300. 283 281. 250 259. Number of ESG Focus Funds 225. 200. 199. 184 189. 168 174. 150 165 163. 154. 143. 127. 100 115. 50. 0. 2004 2005 2006 2007 2008 2009 2010 2011 2012 2013 2014 2015 2016 2017 2018.
5 Source: Morningstar, 2019. MORGAN STANLEY | 2019 2. Sustainable REALIT Y. Methodology What is the difference between Sustainable Funds and traditional Funds in terms of performance and risk? We compared the return and risk-performance of ESG- focused mutual and exchange-traded Funds (ETFs), as defined by Morningstar, against their traditional counterparts from 2004 to 2018, using total Returns and downside deviation. We used Morningstar data on exchange-traded and open-ended mutual Funds active in any given year of the period. In total, 10,723 were sampled using the oldest share class of each fund. For each year analyzed in the study, the distribution of each of is in fact the case. Additionally, we tested the robustness of the the indicators (total return and downside deviation) is described findings. The main approach involved breaking down the two using the median and the interquartile range. The difference in analyses by major asset classes that had enough Sustainable fund the performance between ESG-focused Funds and traditional observation for a meaningful analysis within the sample: Funds for the given year is determined by comparing the two equities, sector equities, international equities and distributions using the non parametric Wilcoxon statistical taxable bonds.
6 Additional robustness checks were performed test, due to the non-normal distribution of the data. This test but do not change our findings.*. evaluates the hypothesis that the two distributions of values are the same and provides an estimate of the likelihood that this Definitions of Categories and Data Points Used TERM MORNINGSTAR DEFINITION. Funds tagged by Morningstar with the ESG Focus attribute are defined as those that prioritize investments based on multiple screens for numerous ESG factors and a variety of strategies, ranging from ESG. integration to exclusion. ESG-Focus Funds Expressed in percentage terms, Morningstar's calculation of total return is determined by taking the change in price, reinvesting, if applicable, all income and capital gains distributions during the period, and dividing by the starting price. Morningstar does not adjust total Returns for sales charges (such as front-end loads, deferred loads, and redemption fees), preferring to give a clearer picture of performance.
7 Total Returns do account for the expense ratio, which includes management, administrative, and other costs as well as Total Returns 12b-1 fees that are taken out of The downside deviation is a value representing the potential loss that may arise from risk as measured against a minimum acceptable return, by isolating the negative portion of the volatility. It is thus similar to standard deviation, but considers only Returns that fall below the minimum acceptable Downside Deviation * A full description of the methodology, robustness checks, definitions of the indicators and the data sampling procedure is available upon request. Please contact with any methodological inquiries. MORGAN STANLEY | 2019 3. Sustainable REALIT Y. Results and Discussion There is no trade-off in the financial performance of Sustainable Funds compared with their traditional peers. Analyzing the total Returns between 2004 and 2018, we find only sporadic and inconsistent differences in performance.
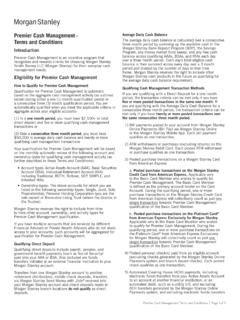
8 Therefore, the Returns of Sustainable Funds were in line with those of traditional Funds . There are arithmetic differences between the medians of the These return findings are shown in Figure 2. As the graph two distributions across the years. However, most of these illustrates, the Returns between the two types of Funds are very differences are not statistically significant, meaning that the two similar. However, Sustainable Funds show a tighter dispersion. distributions are for all intents and purposes equal. Moreover, The table below the graph shows the percentage-point difference there is not a consistency in the direction or magnitude of the between the two types of Funds with respect to medians, and statistical differences that do occasionally appear. an indication whether that difference can be considered statistically significant. FIGURE 2. Median Total Returns of Sustainable and Traditional Funds , 2004 2018: Annual Return %.
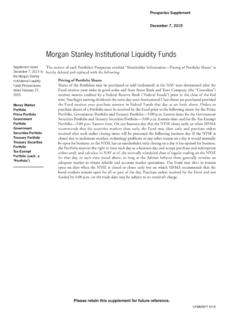
9 2004 2005 2006 2007 2008 2009 2010 2011 2012 2013 2014 2015 2016 2017 2018. Sustainable Funds median Traditional Funds median Difference between medians ( Sustainable Traditional). Difference in median Returns ( Sustainable - Traditional) ** ** **. Statistical Significance 99%+ ** 95%+ ** 90%+ *. Source: Morgan Stanley analysis of Morningstar data, 2019. MORGAN STANLEY | 2019 4. Sustainable REALIT Y. Returns by Asset Class When examining the behavior of total Returns by asset class, in line with traditional Funds ' performance in these two asset we find that the differences between Sustainable and traditional classes post-financial crisis. Funds are similarly narrow and of an inconsistent direction Overall, differences in total Returns between Sustainable and (Figure 3). We also find that the magnitude of these differences traditional Funds are found to be narrow and inconsistent. narrows over time. Looking more closely into the difference As a result, we find that the total Returns of Sustainable mutual of Returns by asset class, we see that there is not a consistent and exchange-traded Funds in the period of 2004-2018 were difference at present, but that this story was different in certain in line with their traditional counterparts.
10 This finding confirms asset classes before 2008. Prior to the fall 2008 financial crisis, the first part of the hypothesis that was derived from academic traditional Funds outperformed in broad Equity and literature, namely that there is no difference in the return International Equity. Sustainable Funds ' performance is more performance between Sustainable and traditional Funds . FIGURE 3. Annual Median Total Returns (%) of Sustainable and Traditional Funds by Asset Class, 2004 - 2018: Asset Class 2004 2005 2006 2007 2008 2009 2010 2011 2012 2013 2014 2015 2016 2017 2018. International Sustainable Equity Traditional Sustainable - Traditional Sector Sustainable Equity Traditional Sustainable - Traditional Taxable Sustainable Bond Traditional Sustainable - Traditional Sustainable Equity Traditional Sustainable - Traditional Shaded cells represent statistically significant differences at a level. Source: Morgan Stanley analysis of Morningstar data, 2019.