Transcription of ANNUAL ADMISSIONS STATISTICAL REPORT
1 ANNUAL ADMISSIONS STATISTICAL REPORTMay 20202020 | UNIVERSITY OF OXFORD ANNUAL ADMISSIONS STATISTICAL REPORTF oreword The University of Oxford has again been ranked the top university in the world in the Times Higher Education Rankings. Largely as a result of our reputation, our personalized education and our formidable research, but also due to our efforts to increase applications from students of under-represented backgrounds, competition for places has become very intense. While the number of undergraduate places has remained broadly constant for the past five years, the number of applications has increased by over 25%. In this, our third ANNUAL ADMISSIONS REPORT , we provide details of these applications and their success rates.
2 We provide information by subject and college applied to, but also information on the applicants and their educational, regional, racial and socio-economic background. The data presented clearly demonstrates steady progress towards diversifying the makeup of our student body. In the past five years, the percentage of state-educated students has increased from to The percentage of students of Black and Minority Ethnic heritage has increased from to Those from the most deprived areas have increased from to and those from areas with low progressions rates to university from to 14%. In an effort to accelerate the pace of change, last year we announced three initiatives to help us to realize our ambition of ensuring that in four years time 25% of British undergraduates admitted to Oxford would be from low-income backgrounds.
3 We increased the size of our UNIQ Summer School by 50%, to 1,350 students, last summer. The first cohort of students admitted via our Opportunity Oxford bridging programme will begin this September, and we will begin the roll-out of Foundation Oxford next year. It is too soon to see the impact of these initiatives on the figures presented here. The impact of the COVID-19 pandemic has exposed the deep education inequalities in our society. We are acutely conscious of the differential impact both on our current students and on those considering applying to Oxford. We have moved our UNIQ Summer programme online in an effort to support those pupils who aspire to apply to Oxford and other highly selective universities. Notwithstanding the major challenge of adapting to the constraints posed by the pandemic, we fully intend to continue our progress towards ensuring that every talented, academically driven pupil in the country, wherever they come from, sees Oxford as a place for them.
4 Professor Louise RichardsonVice-ChancellorContents page 4 Section 1. Overall numbers, including domicile page 7 Section 2. Nation and regionpage 10 Section 3. Disadvantagepage 16 Section 4. School typepage 19 Section 5. Genderpage 22 Section 6. Ethnicitypage 34 Section 7. Disabilitypage 35 Glossarypage 38 Guide to the Oxford ADMISSIONS processpage 39 Note on HESA dataUNIVERSITY OF OXFORD ANNUAL ADMISSIONS STATISTICAL REPORT | 2020 About this REPORT This REPORT presents undergraduate ADMISSIONS statistics for the University of Oxford over five ADMISSIONS years between 2015 and 2019, broken down into chapters covering the following areas: overall numbers, domicile, nation and region, disadvantage, school type, gender, ethnicity and disability.
5 The REPORT includes information for Oxford s colleges and largest courses, aggregated for the three ADMISSIONS years 2017 to 2019. Aggregation has been used as small yearly figures are likely to provide a misleading picture. Nonetheless, some figures remain so small that a handful of decisions can appear to create large swings which have limited STATISTICAL value. This health warning applies even more strongly to single-year statistics for colleges and courses. The full data are available to view online: REPORT also provides some national context for Oxford s data, primarily based on figures from the Higher Education Statistics Agency (HESA). This includes information on the numbers of students achieving Oxford s minimum standard offer: three A grades or better at A-level and equivalent scottish qualifications.
6 It also compares Oxford s data with the higher education sector as a whole and with the Russell Group of leading universities. A summary of Oxford s ADMISSIONS process can be found on page points The number of students applying to study at Oxford has been rising year on year, but the number of undergraduate places available has risen only slightly to around 3,300. In 2019, almost four fifths of those places (2,586) went to students living in the UK. Between 2015 and 2019, within the total group of UK-domiciled undergraduates admitted: The proportion from state schools rose from to The proportion identifying as Black and Minority Ethnic (BME) rose from to The proportion from socio-economically disadvantaged areas rose from to The proportion from areas of low progression to higher education rose from to The proportion declaring a disability rose from to The proportion of women rose from to Percentages in this REPORT have been rounded to one decimal E 32020 | UNIVERSITY OF OXFORD ANNUAL ADMISSIONS STATISTICAL REPORT1.
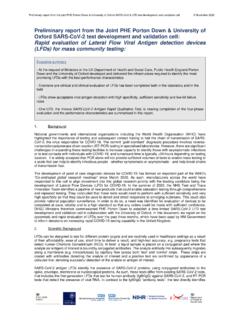
7 Overall numbers, including domicile This section presents information on Oxford s overall numbers, as well as the domicile of Oxford s applicants, offer holders and admitted NUMBERS The total number of undergraduate places available annually at Oxford has risen only slightly to around 3,300. Ov e r a l l a p p l i c a t i o n n u m b e r s h a v e r i s e n a n n u a l l y, a n d by 2 5 . 3 % s i n ce 2 0 1 5 . Table : Overall applications to Oxford, offers made and students admitted, all domiciles, 2015 2019 APPLICATIONSOFFERSSTUDENTS ADMITTED201923,0203,8893,280201821,5153, 8403,309201719,9383,7713,270201619,1443, 7513,262201518,3773,6633,216 Table.
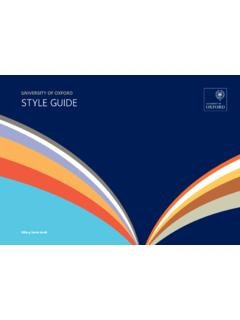
8 Courses with the highest number of applicants per place (all domiciles, three-year total 2017 2019)2 COURSENUMBER OF APPLICANTS PER PLACECOURSENUMBER OF APPLICANTS PER PLACEE conomics & & * ** & Computer *Philosophy, Politics and Economics **Including Law/Law with Studies in Europe A-level grade profile of UK-domiciled students applying to, receiving offers from and being admitted to Oxford (2019 UK intake)s While three A grades is Oxford s minimum standard offer for candidates taking A-levels, many courses particularly in the sciences require at least one A* grade. More than half of applicants and almost 85% of admitted students achieve A*AA or better at A-level. Almost 40% of admitted students achieve three A* grades or better at : This table contains aggregated figures for the period 2017 2019.
9 Aggregated figures for this period will appear throughout the REPORT , most often where tables refer to data by course or by E 42. Table based on 25 largest *AAA*A*AA*A*A* or bettersA-level bands are based on results data obtained from UCAS and include results from the 2019 and 2018 examination rounds. Excludes General Studies and Critical Thinking, and candidates with fewer than three A-level OF OXFORD ANNUAL ADMISSIONS STATISTICAL REPORT | 2020 BREAKDOWN BY DOMICILE The largest percentage increase in applications has been from students outside the EU. UK-domiciled applicants are substantially more likely to receive an offer of a place to study at Oxford than students from outside the UK. The proportion of UK students fell from to from 2015 to 2018, and rose to in 2019.
10 Oxford does not operate quotas or targets around the nationality or domicile of students admitted to the University. The exception is Medicine, which is subject to a government restriction on the number of students with international fee status who can be admitted each year. The highest number of overseas applications and admitted students was from the People s Republic of : Overall applications to Oxford, offers made and students admitted by area of domicile, 2015 2019UK STUDENTSAPPLICATIONSOFFERSSTUDENTS ADMITTEDPROPORTION OF TOTAL APPLICANTSPROPORTION OF TOTAL STUDENTS ADMITTED201913,8773,0552, ,0132,9602, ,5832,9282, ,1932,9892, ,7292,8912, STUDENTSAPPLICATIONSOFFERSSTUDENTS ADMITTEDPROPORTION OF TOTAL APPLICANTSPROPORTION OF TOTAL STUDENTS ADMITTED20192, , , , , STUDENTSAPPLICATIONSOFFERSSTUDENTS ADMITTEDPROPORTION OF TOTAL APPLICANTSPROPORTION OF TOTAL STUDENTS ADMITTED20196, , , , , E 52020 | UNIVERSITY OF OXFORD ANNUAL ADMISSIONS STATISTICAL REPORTT able.