Transcription of Annual Energy Outlook 2022 (AEO2022)
1 Energy Information AdministrationIndependent Statistics & AnalysisAnnual Energy Outlook 2022 (AEO2022) ForAnnual Energy Outlook 2022 Release at the Bipartisan Policy CenterMarch 3, 2022 | Washington, DCByStephen Nalley, Acting EIA AdministratorAngelina LaRose, Assistant Administrator for Energy AnalysisAEO2022 Highlights Petroleum and natural gas remain the most-consumed sources of Energy in the United States through 2050, but renewable Energy is the fastest growing Wind and solar incentives, along with falling technology costs, support robust competition with natural gas for electricity generation, while the shares of coal and nuclear power decrease in the electricity mix crude oil production reaches record highs, while natural gas production is increasingly driven by natural gas exports AEO2022 Press Release March 3, 20222 AEO2022 examines a range of conditions from 2020 to 2050 Assumptions Current laws and regulations as of November 2021 Current views on economic and demographic trends.
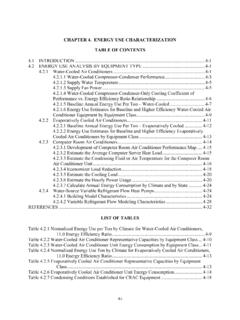
2 And technology improvements Compound Annual growth rate for real gross domestic product (GDP) is (Reference case) High Economic Growth case ( ) and Low Economic Growth case ( ) The Brent crude oil price by 2050 is $90 per barrel (b) in constant 2021 dollars (Reference case) High Oil Price case ($170/b) and Low Oil Price case ($45/b) Oil and natural gas supply cases High: more accessible resources and lower extraction technology costs than the Reference case Low: fewer accessible resources and higher extraction technology costs than the Reference case Renewables cost cases High: no cost reductions in renewable technologies Low: renewables achieve 40% lower overnight capital costs by 2050 compared to Reference caseAEO2022 Press Release March 3, 20223 Changes in AEO2022: Pandemic and Legislation COVID-19 continues to be a major source of uncertainty, especially in the near term. AEO2022 includes provisions from the Bipartisan Infrastructure LawAEO2022 Press Release March 3, 20224$0$10$20$3020152020202520302021hist ory projectionsHigh EconomicGrowthReference Low Economic gross domestic product assumptionsAEO2022 economic growth casestrillion 2012 dollarsThe Energy Information Administration (EIA) collects, analyzes, and disseminates independent and impartial Energy information to promote sound policymaking, efficient markets, and public understanding of Energy and its interaction with the economy and the environment.
3 EIA s role is unique by providing an unbiased view of Energy markets, EIA increases transparency and promotes public understanding of important Energy has expanded its program in recent years to provide a growing customer base with coverage of increasingly complex and interrelated Energy markets. AEO2022 Press Release March 3, 20225 AEO2022 core cases vary technical and macroeconomic assumptionsAEO2022 Press Release March 3, 20226 Low Economic Growth caseLow Oil Price caseLow Oil and Gas Supply caseLow Renewables Cost caseReference caseHigh Economic Growth caseHigh Oil Price caseHigh Oil and Gas Supply caseHigh Renewables Cost caseHigherLowerExpectedCurrent laws and regulations as of November 2021 Potentialnew lawsTechnical and macroeconomic assumptionsPolicy assumptionsUpcoming AEO2022 Issue in Focus cases vary technical, macroeconomic, and policy assumptions Alternative policies assumptions Carbon fee Sunset credits Extended credits No new pipelines Alternative technical and macroeconomic assumptions Alternative weather assumptions Use cases for battery storageAEO2022 Press Release March 3.
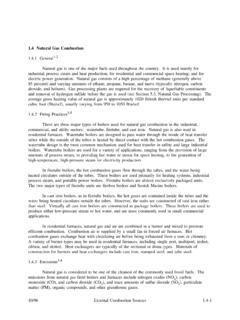
4 20227 AEO2022 Highlights Petroleum and natural gas remain the most-consumed sources of Energy in the United States through 2050, but renewable Energy is the fastest growing Wind and solar incentives, along with falling technology costs, support robust competition with natural gas for electricity generation, while the shares of coal and nuclear power decrease in the electricity mix crude oil production reaches record highs, while natural gas production is increasingly driven by natural gas exports AEO2022 Press Release March 3, 20228 Energy consumption by fuel AEO2022 Reference casequadrillion british thermal unitsAEO2022 Press Release March 3, 2022 Renewables consumption grows fastest but remains far below petroleum and other liquids consumption in 2050901020304050199020002010202020302040 20502021historyprojectionspetroleumand other liquidsnatural gascoalother renewable energynuclearhydroliquid biofuelsEnergy consumption by sectorAEO2022 Reference casequadrillion british thermal units01020304050199020002010202020302040 2050electric powertransportationindustrialresidential commercial2021historyprojectionsNote.
5 Biofuels are shown separately and included in petroleum and other and other liquids are largely consumed by sectors with slow turnover to electric equipmentAEO2022 Press Release March 3, 2022100510152025302020203020402050transp ortationindustrialcommercialresidentiale lectric power2021projections Petroleum and other liquids consumption by sectorAEO2022 Reference casequadrillion british thermal units05101520201020202030204020502021his tory projectionsotherelectric hybrid plug-in electrichybridbattery electricdieselflex fuelgasolineLight-dutyvehicle sales by technologyor fuel AEO2022 Reference casemillions of vehicles012320102020203020402050 New vehicle sales of battery-powered vehicles AEO2022 Reference casemillionsof vehiclestotal battery electricincluding 100-, 200-, 300-mile electric vehicleselectric hybrid 300-mile electric plug-in electric hybrid 200-mile electric100-mile electric2021history projections203020402050-30369 Natural gas consumption rises mostly because of industrial use and exports11net exportselectric powercommercialresidentialtransportation industrialNatural gas disposition and net exportsAEO2022 Reference casetrillion cubic feetChange in natural gas disposition and net exportsAEO2022 Reference caserelative to 2021 in trillion cubic feetnet exportselectric powercommercialtransportationindustrialr esidential051015202530354020202030204020 50 AEO2022 Press Release March 3.
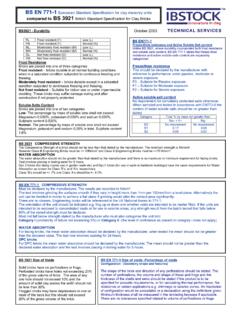
6 2022 Energy -related CO2 emissions by sector and powerresidentialcommercial2021history gascoal2021history projectionsEnergy-related CO2 emissions by fuel AEO2022 Reference casebillion metric tons Energy -related CO2 emissions by sectorAEO2022 Reference casebillion metric tons12 Note: Series does not include greenhouse gases other than CO2. Industrial sector CO2 emissions do not include process emissions, such as the emissions from cement clinker Press Release March 3, 2022 AEO2022 Highlights Petroleum and natural gas remain the most-consumed sources of Energy in the United States through 2050, but renewable Energy is the fastest growing Wind and solar incentives, along with falling technology costs, support robust competition with natural gas for electricity generation, while the shares of coal and nuclear power decrease in the electricity mix crude oil production reaches record highs, while natural gas production is increasingly driven by natural gas exports AEO2022 Press Release March 3, 202213 AEO2022 Press Release March 3, 2022 The Annual average electricity growth rate remains below 1% across much of the projection period in the Reference case14-2%-1%0%1%2%3%4%5% electricity use growth rate.
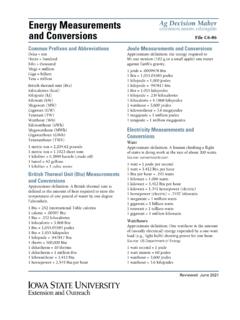
7 Three-year rolling averageAEO2022 economic growth casespercentage growth 2021historyprojectionsHigh Economic GrowthReferenceLow Economic Growth04008001,2001,6002, use by end-use sector AEO2022 Reference case billion kilowatthoursonsite generationpurchased electricityresidential industrialcommercial transportationRenewables consumption for electricity generation grows significantly in all cases, even as it trades off with nuclear, coal, and natural gas15 AEO2022 Press Release March 3, 2022 Note: Other renewables category includes electricity generation from hydroelectric, geothermal, wood, and other biomass sources. 05001,0001,5002,0002,5002010202020302040 20502021projectionsHigh Renewables Cost case05001,0001,5002,0002,500201020202030 204020502021projectionsLow Renewables Cost case05001,0001,5002,0002,500199020102030 20502021history projectionsReference casenatural gassolarwindnuclearcoalother electricity generationbillion kilowatthours16 Hourly electricity generation and load by fuel for selected cases and yearsbillion kilowatthoursAEO2022 Reference case, 2021 AEO2022 Reference case, 2050 AEO2022 Low Renewables Cost case, 2050hour of the daycurtailmentbattery storage pumped storage solarwind hydroelectric naturalgas combined-cyclenaturalgas and oilpeakersnuclearcoalSignificant renewables growth leads to additional battery storageAEO2022 Press Release March 3, 2022 Note: Negative generation represents charging of Energy storage technologies such as pumped hydro and battery storage.
8 Hourlydispatch estimates are illustrative and are developed to determine curtailment and storage operations; final dispatch estimates are developed separately and may differ from total utilization as this figure shows. Solar includes both utility-scale and end-use photovoltaic electricity generation. -50050100150200250300159131721load159131 721load159131721loadAEO2022 Highlights Petroleum and natural gas remain the most-consumed sources of Energy in the United States through 2050, but renewable Energy is the fastest growing Wind and solar incentives, along with falling technology costs, support robust competition with natural gas for electricity generation, while the shares of coal and nuclear power decrease in the electricity mix crude oil production reaches record highs, while natural gas production is increasingly driven by natural gas exports AEO2022 Press Release March 3, 2022170510152025201020202030204020502021 history crude oil productionAEO2022 Reference case and side casesmillion barrels per dayProduction of crude oil rises early in the projection and remains largely flat in the Reference case18 High Oil PriceHigh Oil and Gas SupplyReferenceLow Oil PriceLow Oil and Gas SupplyAEO2022 Press Release March 3, 2022$0$50$100$150$2002010202020302040205 0 High Oil PriceLow Oil and Gas SupplyReferenceHigh Oil and Gas SupplyLow Oil Price2021history projectionsNorth Sea Brent crude oil priceAEO2022 side cases2021 dollars per barrelThe United States remains a net exporter of total liquids and a net importer of crude oil in the Reference case19 AEO2022 Press Release March 3.
9 2022-12-8-404812162010202020302040205020 21historyprojectionsimportsexportsnet importsTotal petroleum and other liquids tradeAEO2022 Reference casemillion barrels per day-12-8-4048121620102020203020402050202 1historyprojectionsimportsexportsnet importsCrude oil tradeAEO2022 Reference casemillion barrels per day0102030405060200020102020203020402050 Dry natural gas productionAEO2022 side casestrillion cubic natural gas production grows in most cases, but price and technology assumptions play a central role202021history projectionsHigh Oil andGas SupplyHigh Oil PriceReferenceLow Oil PriceLow Oil and Gas SupplyAEO2022 Press Release March 3, 2022 AEO2022 Press Release March 3, 202221 Natural gas and liquefied natural gas (LNG) trade reaches 8 trillion cubic feet in the Reference natural gas trade, AEO2022 oil and natural gas supply cases-50510152020203020402050-5051015202 0203020402050-50510152020203020402050 Low Oil and Gas Supply casetrillion cubic feetHigh Oil and Gas Supply casetrillion cubic feet billion cubic feet per dayReference casetrillion cubic feetLNG exportsnet exportspipeline exports to Mexicopipeline exportsto Canadapipeline importsfrom CanadaLNG importsAEO2022 Highlights Petroleum and natural gas remain the most-consumed sources of Energy in the United States through 2050, but renewable Energy is the fastest growing Wind and solar incentives, along with falling technology costs, support robust competition with natural gas for electricity generation, while the shares of coal and nuclear power decrease in the electricity mix crude oil production reaches record highs.
10 While natural gas production is increasingly driven by natural gas exports AEO2022 Press Release March 3, 202222 AEO2022 Press Release March 3, 202223 View the full report at us at