Transcription of Annual Financial Report 2020 - Toyota Industries
1 Annual Financial Report 2020 For the Year Ended March 31, 2020 Financial Summary P1 Management's Discussion and Analysis of Financial Condition and Results of Operations P3 consolidated Statement of Financial Position P11 consolidated Statement of Profit or Loss P13 consolidated Statement of Comprehensive Income P14 consolidated Statement of Changes in Equity P15 consolidated Statement of Cash Flows P17 Notes to consolidated Financial Statements P19 Report of Independent Auditors P91 Toyota Industries CORPORATION 1 Financial Summary Toyota Industries Corporation and its consolidated subsidiaries < IFRS > FY2016 FY2017 FY2018 FY2019 FY2020 Net sales (Millions of yen) 1,696,856 1,675,148 2,003,973 2,214,946 2,171,355 Operating profit (Millions of yen) 137,026 127,345 147,445 134,684 128,233 Profit (Millions of yen) 199,956 137,565 173,816 159,778 150,187 Profit: attributable to owners of the parent (Millions of yen) 194,270 131,398 168,180 152,748 145,881 Comprehensive income (Millions of yen) (253,021) 202,743 361,599 (16,789) 10,474 Share of equity attributable to owners of the parent (Millions of yen) 2,098,658 2,240,293 2,553,391 2,479,718 2,438,807 Total assets (Millions of yen) 4,317,282 4,558,212 5,258,500 5,261,174 5,279,653 Equity per share.
2 Attributable to owners of the parent (Yen) 6, 7, 8, 7, 7, Earnings per share basic (Yen) Earnings per share diluted (Yen) Ratio of equity attributable to owners of the parent to total assets (%) Return on equity attributable to owners of the parent (%) Price-to-earnings ratio (Times) Net cash provided by operating activities (Millions of yen) 248,049 239,094 268,567 270,306 313,199 Net cash used in investing activities (Millions of yen) (532,238) (86,925) (340,324) (395,000) (182,598) Net cash provided by financing activities (Millions of yen) 124,495 789 153,303 40,467 (7,094) Cash and cash equivalents at end of period (Millions of yen) 92,399 243,685 323,830 239,140 358,144 Number of employees [Average number of part-time employees, not included in number of employees above] 51,458 [9,871] 52,623 [10,995] 61,152 [11,705] 64,641 [12,625] 66,478 [12,788] (Notes) 1. Toyota Industries Corporation and its subsidiaries have adopted International Financial Reporting Standards ("IFRS") for the consolidated Financial statements of the Annual Report from the fiscal year ended March 31, 2017.
3 The date of transition to IFRS is April 1, 2015. (Notes) 2. Net sales do not include consumption taxes. (Notes) 3. Amounts for diluted earnings per share are not presented for FY2017, FY2018, FY2019 and FY2020 because there are no shares with a potentially dilutive effect. (Notes) 4. Number of employees is the number of workers (excluding people dispatched from the Group to outside the Group, but including people dispatched from outside the Group to the Group). 2 < Japanese GAAP > FY2016 FY2017 Net sales (Millions of yen) 2,243,220 2,250,466 Ordinary profit (Millions of yen) 185,398 177,121 Profit: attributable to owners of the parent (Millions of yen) 183,036 125,534 Comprehensive income (Millions of yen) (277,053) 198,548 Total equity (Millions of yen) 2,113,948 2,256,271 Total assets (Millions of yen) 4,199,196 4,428,644 Equity per share (Yen) 6, 6, Earnings per share basic (Yen) Earnings per share diluted (Yen) Equity-to-total assets ratio (%) Return on equity (%) Price-to-earnings ratio (Times) Net cash provided by operating activities (Millions of yen) 240,169 245,602 Net cash used in investing activities (Millions of yen) (531,561) (82,509) Net cash provided by (used in) by financing activities (Millions of yen) 130,923 (6,615) Cash and cash equivalents at end of period (Millions of yen) 92,399 243,685 Number of employees [Average number of part-time employees, not included in number of employees above] 51,458 [9,871] 52,623 [10,995] (Notes) 1.
4 Amounts for FY2017 are unaudited Financial information pursuant to the first paragraph of Article 193-2 of the Financial Instruments and Exchange Act. (Notes) 2. Net sales do not include consumption taxes. (Notes) 3. Certain FY2016 amounts have been reclassified to conform to the changes in presentation in FY2017. (Notes) 4. Amounts for diluted earnings per share are not presented for FY2017 because there are no shares with a potentially dilutive effect. (Notes) 5. Number of employees is the number of workers (excluding people dispatched from the Group to outside the Group, but including people dispatched from outside the Group to the Group). 3 Management's Discussion and Analysis of Financial Condition and Results of Operations The following Management's Discussion and Analysis of Financial Condition and Results of Operations is based on information known to management as of June 2020. This section contains projections and forward-looking statements that involve risks, uncertainties and assumptions.
5 You should be aware that certain risks and uncertainties could cause the actual results of Toyota Industries Corporation and its consolidated subsidiaries to differ materially from any projections or forward-looking statements. These risks and uncertainties include, but are not limited to, those listed under "Risk Information" and elsewhere in this Annual Report . The fiscal year ended March 31, 2020 is referred to as FY2020 and other fiscal years are referred to in a corresponding manner. All references to the "Company" herein are to Toyota Industries Corporation on a stand-alone basis and references to " Toyota Industries " herein are to the Company and its 256 consolidated subsidiaries. 1. Result of Operations (1) Operating Performance In FY2020 (ended March 31, 2020), the global economy was solid overall despite such uncertainties as the deceleration of the Chinese economy arising from trade frictions and geopolitical risks.
6 However, during the few months leading to the fiscal year-end the global economy went on a dramatic downward spiral due to the spread of COVID-19. Meanwhile, the Japanese economy deteriorated during the second half of FY2020. In addition to the factors mentioned above, the primary reasons for the deterioration included a decrease in anemic consumer spending that accompanied the consumption tax hike and natural disaster. In this operating environment, Toyota Industries undertook efforts to ensure customer trust through a priority to quality as well as to respond flexibly to market trends. Total consolidated net sales amounted to 2, billion yen, a decrease of billion yen, or 2%, from the previous fiscal year. (2) Operating Performance Highlights by Business Segment Operating results by business segment are as follows. Net sales for each segment do not include inter-segment transactions. (Automobile) The automobile market remained roughly on par with the previous fiscal year in Japan despite contraction in other areas.
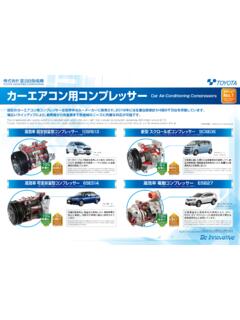
7 Amid such operating conditions, net sales of the Automobile Segment totaled billion yen, an increase of billion yen, or 1%. Operating profit amounted to billion yen, an increase of billion yen, or 153%, from the previous fiscal year. Within this segment, net sales of the Vehicle Business amounted to billion yen, an increase of billion yen, or 9%, due mainly to increases in sales of the new RAV4 whose production started in November 2018. Net sales of the Engine Business totaled billion yen, an increase of billion yen, or 13%, resulting mainly from increases in sales of new A25A and M20A gasoline engines. Net sales of the Car Air-Conditioning Compressor Business totaled billion yen, a decrease of billion yen, or 5%. Sales in Japan increased while those in North America and Europe decreased. Net sales of Electronics Parts, Foundry and Others Business totaled billion yen, on par with the previous fiscal year.
8 This was because decreases in sales of foundry products were offset by increases in sales of electronics parts. 4 (Materials Handling Equipment) The materials handling equipment market remained roughly on par with the previous fiscal year in North America, while it shrank in Europe. Amid this operating climate, net sales of the Materials Handling Equipment Segment totaled 1, billion yen, a decrease of billion yen, or 2%. This was due primarily to decreases in sales of mainstay lift trucks and the impact of exchange rate fluctuations. Operating profit amounted to billion yen, a decrease of billion yen, or 11%, from the previous fiscal year. (Textile Machinery) The textile machinery market was stagnant in Asia, including China, Toyota Industries ' primary market. Net sales of the Textile Machinery Segment totaled billion yen, a decrease of billion yen, or 19%, due mainly to decreases in sales of weaving machinery and yarn quality measurement instruments.
9 Operating profit amounted to billion yen, a decrease of billion yen, or 60%, from the previous fiscal year. (3) Operating profit Operating profit for FY2020 was billion yen, a decrease of billion yen, or 5%, from the previous fiscal year. This was due mainly to the impact of COVID-19, Typhoon No. 19 (Hagibis) and exchange rate fluctuations, partially offset by sales efforts and increases in promoting cost reduction efforts throughout the Toyota Industries Group. (4) Profit before income taxes Profit before income taxes amounted to billion yen, a decrease of billion yen, or 3%, from the previous fiscal year. This was due mainly to a decrease in operating profit of billion yen, or 5%, from the previous fiscal year to billion yen. (5) Profit attributable to owners of the parent Profit attributable to owners of the parent totaled billion yen, a decrease of billion yen, or 4%, from the previous fiscal year.
10 Earnings per share basic was yen compared with yen in the previous fiscal year. 2. consolidated Financial Condition Total assets amounted to 5, billion yen, an increase of billion yen from the end of the previous fiscal year. This was because a decrease in fair value of investment securities was offset mainly by an increase in cash and cash equivalents, and property, plant and equipment. Liabilities amounted to 2, billion yen, an increase of billion yen from the end of the previous fiscal year, due mainly to an increase in corporate bonds and loans. Equity amounted to 2, billion yen, a decrease of billion yen from the end of the previous fiscal year. 3. Liquidity and Capital Resources (1) Capital needs and returning profits to shareholders Toyota Industries ' primary capital needs are twofold, specifically, long-term capital needs for research and development, capital investment, M&A and others as well as working capital needs for purchasing raw materials and parts for manufacturing the Group's products and for manufacturing costs and selling, general and administrative expenses.