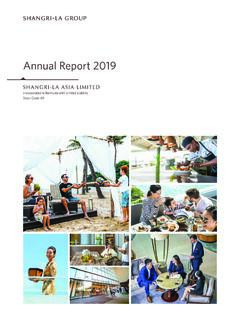
Transcription of Annual Report 2020
1 Annual Report 2020. Incorporated in Bermuda with Limited Liability Stock Code: 69. Cover Photos: 2 1. Shangri-La Hotel, Qaryat Al Beri, Abu Dhabi . 1 4 2. China World Mall 3 3. Shangri-La Hotel, At The Shard, London 4. Shangri-La's Fijian Resort and Spa, Yanuca Island, Fiji 5. Shangri-La's Le Touessrok Resort & Spa, Mauritius 5 6 6. Shangri-La Hotel, Ulaanbaatar Contents Overview 2. Corporate Governance Report 90. The Group's Business Presence 2 Directors Handbook and Corporate 92. Governance Functions Financial Highlights 3.
2 Board 94. Corporate Information 5. Executive Committee 95. Year in Review 6. Nomination Committee 96. Awards of the Year 9. Remuneration Committee 99. Chairman's Statement 10. Audit & Risk Committee 102. Board of Directors, Company Secretary and 13. Senior Management Risk Management and Internal Controls 104. External Auditors 108. General Meeting(s) 109. Discussion and Analysis 24. General Mandates Granted to Directors 110. Consolidated Statement of Profit or Loss 28 Dividend Policy 110. Summary of Net Asset Value 29 Investor Relations 1 1 1.
3 Results of Operations 30 Public Float 112. Corporate Debt and Financial Conditions 43. Treasury Policies 45. Investment Properties Valuation 47. Financial Report 113. Impairment Provision 47 Independent Auditor's Report 113. Financial Assets Trading Securities 48 Consolidated Statement of Financial Position 119. Development Programmes 48 Consolidated Statement of Profit or Loss 121. Management Contracts for Hotels 49 Consolidated Statement 122. Owned by Third Parties of Comprehensive Income Human Resources 49 Consolidated Statement of Changes in Equity 123.
4 Prospects 51 Consolidated Cash Flow Statement 125. Notes to the Consolidated Financial Statements 1 2 6. Five Year Summary 236. Properties Under Development 52. Abbreviations 237. The Group's Listed Members 240. Responsible Business 58. Directors' Report 68. General Disclosure Items 70. Directors 71. Significant Shareholders' Interests 72. Directors' Interests 73. Share Option Scheme 75. Share Award Scheme 78. Connected Transaction(s) 81. Continuing Connected Transaction(s) 81. Overview The Group's Business Presence Mongolia Mainland China Japan United Arab Emirates Bahrain Oman Taiwan India Saudi Arabia hong kong SAR.
5 Myanmar Thailand Cambodia Philippines Sri Lanka Malaysia As at 31 December 2020. Business in operation Maldives Singapore Projects under development Indonesia Asia Bahrain Mainland China Malaysia Oman Sri Lanka Cambodia Baotou Hefei Qufu Yangzhou Johor Muscat Colombo Phnom Penh Beihai Huhhot Sanya Yiwu Kota Kinabalu Philippines Hambantota Beijing Jinan Shanghai Zhengzhou Penang Boracay Taiwan hong kong SAR Changchun Kunming Shangri-La Kuala Lumpur Zhoushan Cebu Tainan India Changzhou Lhasa Shenyang Maldives Manila Taipei Bengaluru Chengdu Manzhouli Shenzhen Male New Delhi Dalian
6 Nanchang Suzhou Saudi Arabia Thailand Villingili Jeddah Bangkok Indonesia Fuzhou Nanjing Tangshan Guangzhou Nanning Tianjin Mongolia Singapore Chiang Mai Jakarta Ulaanbaatar Surabaya Guilin Ningbo Wenzhou United Arab Haikou Putian Wuhan Myanmar Emirates Japan Hangzhou Qingdao Xiamen Yangon Abu Dhabi Tokyo Harbin Qinhuangdao Xian Dubai Kyoto Fiji Australia Canada United Kingdom France Turkey Mauritius Oceania Europe Africa North America Australia Fiji France United Mauritius Canada Cairns Yanuca Paris Kingdom Toronto Sydney Turkey London Vancouver Melbourne Istanbul 2 Shangri-La Asia Limited Annual Report 2020.
7 Overview Financial Highlights The following table summarises the highlights of our financial results: 2020 2019 2020/19. USD Million USD Million % Change Consolidated Revenue 1, 2, EBITDA (Note 1). of the Company and its subsidiaries ( ) N/M. Effective share of EBITDA (Note 2). of the Company, subsidiaries and associates (Loss)/Profit attributable to owners of the Company Operating items ( ) N/M. Non-operating items ( ) N/M. Total ( ) N/M. (Loss)/Earnings per share (US cents per share) ( ) N/M. Dividends per share (HK cents per share) Nil 8 N/A.
8 Net assets attributable to owners of the Company 6, 6, Net assets per share attributable to owners of the Company (USD) (N/M: Not meaningful). Notes: 1. EBITDA, which is a non-HKFRS financial measure used to measure the Group's operating profitability, is defined as the earnings before finance costs, tax, depreciation and amortisation, gains/losses on disposal of fixed assets and non-operating items such as gains/losses on disposal of interest in investee companies; fair value gains/losses on investment properties and financial assets; and impairment losses on fixed assets.
9 2. Effective share of EBITDA is the aggregate total of the Company's EBITDA and the Group's share of EBITDA of subsidiaries and associates based on percentage of equity interests. Segment Revenue by Category Effective Share of EBITDA by Category (USD Million) (USD Million). 2,431. 166 865. 92 114. Property Development Property Development 259. for Sale & Other Business for Sale & Other Business Investment Properties Investment Properties 2,173. 1,033. 28. Hotel Operation 519 Hotel Operation 90 182. 49 Corporate &.
10 915 Pre-opening Expenses 244. -95 -27. 2020 2019 -16. 2020 2019. Shangri-La Asia Limited Annual Report 2020 3. Overview Financial Highlights Movement of Cashflow (Note). (USD Million). 1, ( ) ( ). ( ). Cash at Cash used in Capital Interest paid for Dividend Net proceeds Net change Others Cash at 1 January operations including expenditure borrowings net income from bonds in loans 31 December 2020 lease related of interest income from 2020. payments associates Note: Movement of cashflow is presented from management's perspective which may be different from the cashflow presented in accordance with HKFRS disclosure requirements Debt refinancing schedule chart including undrawn facilities (USD Million).


