Transcription of ANNUAL REPORT Financial Review 2020 - bridgestone.com
1 ANNUAL REPORT 2020 Financial ReviewANNUAL REPORT 2020 Financial Review1 The Group has prepared its consolidated Financial state-ments in accordance with International Financial Reporting Standards (IFRS) beginning from fiscal 2020. Figures for fiscal 2019 are reclassified under IFRS and are stated together for comparison. Unless stated otherwise, all figures are taken from the consolidated Financial statements and notes. dollar figures have been translated solely for the convenience of readers outside Japan at the rate of to $1, the prevailing exchange rate on December 31, 2020. Results of OperationsBusiness environmentIn terms of the Group s operating environment, after a global decline in tire demand caused by the novel corona-virus disease (COVID-19) during the first and second quarter of fiscal 2020, the Group saw a recovery in demand during the third quarter as restrictions on the movement of people and goods were eased and economic activities resumed.
2 In the fourth quarter, a second wave of COVID-19 caused a decline in demand for passenger vehicle tires, whereas demand for truck and bus tires remained strong as the trend of recovery continued. For the full year, the Group experienced a large decline in tire demand compared with the previous fiscal , adjusted operating profit, and operating profit Revenue decreased by billion ($4,954 million), or 15%, from the previous fiscal year, to 2, billion ($28,933 million), primarily due to a drop in global demand for tires as a result of COVID-19. For the same reason, adjusted operating profit decreased by billion ($1,161 million), or 35%, from the previous fiscal year, to billion ($2,154 million). In addition, operating profit decreased by billion ($2,756 million), or 82%, from the previous fiscal year, to billion ($619 million), due to the recording of impair-ment losses of billion, of which billion was recorded as business and plant restructuring expenses.
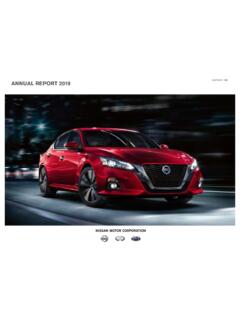
3 As a result, the adjusted operating profit margin dropped percentage points, to The average yen/dollar exchange rate in fiscal 2020 was 107, compared with 109 in the previous fiscal year, while the average yen/euro exchange rate in fiscal 2020 was 122, compared with 122 in the previous fiscal s Discussion and Analysis The Bridgestone Corporation is referred to as the Company, and the Company and its subsidiaries are referred to as the Group in this StatementsThe descriptions of projections and plans that appear in this ANNUAL REPORT are forward-looking statements. They involve known and unknown risks and uncertainties in regard to such factors as product liability, currency exchange rates, raw material costs, labor-management relations, and political stability. These and other variables could cause the Bridgestone Group s actual performance and results to differ from management s projections and 1 Management s Discussion and Analysis 4 Eleven-Year Summary 6 Operational Risks 10 Remuneration for Directors and Executive Officers 12 Stock Holdings 16 Consolidated Statement of Financial Position 18 Consolidated Statement of Profit or Loss 19 Consolidated Statement of Comprehensive Income20 Consolidated Statement of Changes in Equity 21 Consolidated Statement of Cash Flows 22 Notes to Consolidated Financial Statements 87 independent Auditor s ReportAdjusted Operating Profit Margin20202019201820172016 IFRSJ-GAAP % of net IFRS Operating Profit billion801301801221071092016201720182019 2020 120/ 1 109/$1127112130110122 Currency Exchange RatesAnnual average rates IFRS J-GAAPR evenue
4 Billion202020192018201720162, , , , , CorporationANNUAL REPORT 2020 Financial Review32 Financial ConditionAssets Total current assets were 2, billion ($19,851 million), increasing by billion ($1,315 million), or 7%, from the end of the previous fiscal year, as trade and other receiv-ables decreased by billion ($846 million), and inventories decreased by billion ($1,342 million), whereas cash and cash equivalents increased by billion ($3,649 million). Non-current assets were 2, billion ($20,626 million), decreasing by billion ($2,162 million), or 9%, from the end of the previous fiscal year, as property, plant and equipment decreased by billion ($1,575 million), mainly due to the recording of impairment Total current liabilities were 1, billion ($10,065 million), increasing by billion ($1,415 million), or 16%, from the end of the previous fiscal year, as trade and other payables decreased by billion ($318 million), whereas bonds and borrowings increased by billion ($1,532 million).
5 Total non-current liabilities were billion ($9,201 million), decreasing by billion ($260 million), or 3%, from the end of the previous fiscal year, as bonds and borrowings increased by billion ($63 million), whereas retirement benefit liabilities decreased by billion ($193 million) and deferred tax liabilities decreased by billion ($152 million). Furthermore, total interest-bearing debt recorded in both current liabilities and non-current liabilities increased by billion ($1,563 million), or 19%, from the end of the previous fiscal year, to 1, billion ($9,722 million).Note: Interest-bearing debt includes bonds and borrowings and lease Total equity was 2, billion ($21,211 million), decreasing by billion ($2,002 million), or 9%, from the end of the previous fiscal year, as the Group recorded loss attributable to owners of parent of billion ($225 million), due in part to dividends paid (owners of parent) of billion ($884 million).
6 As a result, total assets at the end of fiscal 2020 amounted to 4, billion ($40,477 million), decreasing by billion ($847 million), or 2%, from the end of the previous fiscal year. Furthermore, the ratio of equity attrib-utable to owners of parent to total assets for fiscal 2020 was , down percentage points from the end of the previous fiscal by business segmentThe following business results for each segment reflect a major decline in tire demand that took place over the course of fiscal 2020 in comparison with the previous fiscal year, despite a definite recovery in demand in the third and fourth quarter of fiscal 2020 from a global decline in tire demand caused by COVID-19 in the first and second quarter. The segment results include inter-segment transactions that are eliminated when calculating consolidated results. JapanIn Japan, unit sales of tires for passenger cars and light trucks and unit sales of tires for trucks and buses decreased substantially compared with fiscal 2019.
7 As a result, revenue decreased by 17%, to billion ($7,368 million), and adjusted operating profit decreased by 41%, to billion ($624 million), from the previous fiscal year. AmericasIn the Americas, unit sales of tires for passenger cars and light trucks in North America and overall unit sales of tires for trucks and buses decreased significantly compared with fiscal 2019. As a result, revenue decreased by 15%, to 1, billion ($13,603 million), and adjusted operating profit decreased by 24%, to billion ($1,352 million), from the previous fiscal year. Europe, Russia, Middle East, India and AfricaIn Europe, unit sales of tires for passenger cars and light trucks and unit sales of tires for trucks and buses decreased considerably compared with fiscal 2019. As a result, revenue decreased by 12%, to billion ($5,452 million), and adjusted operating profit amounted to a loss of billion ($170 million), compared with a profit of billion in the previous fiscal year.
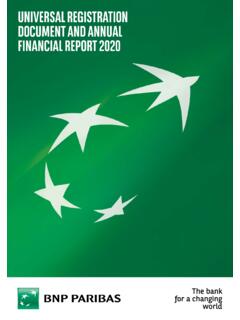
8 China, Asia-PacificIn China and the Asia-Pacific region, unit sales of tires for passenger cars and light trucks and unit sales of tires for trucks and buses decreased substantially compared with fiscal 2019. As a result, revenue decreased by 15%, to billion ($3,813 million), and adjusted operating profit decreased by 32%, to billion ($238 million), from the previous fiscal by Business SegmentNet of inter-segment transactions20202019 billionJapan Americas1, 1, Europe, Russia, Middle East, India and China, Composition of Revenue by Business SegmentNet of inter-segment transactions20202019 % of net sales , Russia, Middle East, India and , attributable to owners of parentIn fiscal 2020, profit attributable to owners of parent decreased from a profit of billion in fiscal 2019 to a loss of billion ($225 million), due to the recording of a decrease in operating profit of billion ($2,756 million) and an impairment loss related to shares using equity method of billion ($176 million).
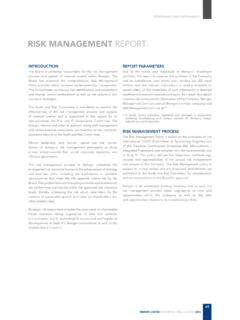
9 Management s Discussion and Analysis IFRS ( ) Attributable to Owners of Parent billion IFRS J-GAAP4, , , , , Assets billion IFRS J-GAAP2, , , , , Equity billion IFRS of Equity Attributable to Owners of Parent%Bridgestone CorporationANNUAL REPORT 2020 Financial Review54 Return on Invested Capital20202019201820172016 IFRSJ-GAAP % of net Net Return on Shareholders Equity20202019201820172016 IFRSJ-GAAP % of net sales flow Cash and cash equivalents (hereinafter net cash ) increased by billion ($3,649 million) during fiscal 2020, to billion ($7,831 million), compared with a decrease of billion during the previous fiscal year. Net cash provided by operating activities increased by billion ($212 million) compared with the previous fiscal year, to billion ($5,091 million). The principal reasons for this increase include profit before tax of billion ($283 million), compared with billion in the previous fiscal year; depreciation and amortization of billion ($2,584 million), compared with billion in the previous fiscal year.
10 Impairment losses of billion 2020201920182017201620152014201320122011 2010 IFRSJ-GAAPJ-GAAPM illions of yen, except per share data and Financial ratiosMillions of yen, except per share data and Financial ratiosRevenue 2,994,524 3,507,243 3,650,111 3,643,428 3,337,017 3,790,251 3,673,965 3,568,091 3,039,738 3,024,356 2,861,615 Adjusted operating profit222,932343,122402,732 419,047449,549517,248478,038438,132285,9 95 191,322166,450 Profit (loss) attributable to owners of parent(23,301)240,111291,642 288,276265,551284,294300,589202,054171,6 06 102,97098,914 Total equity2,195,2912,402,4772,436,162 2,402,7392,345,9002,282,0122,146,6581,86 2,9641,417,348 1,165,6721,176,147 Total assets4,189,3274,277,0163,840,2703,959,0 393,716,0303,795,8473,960,9083,577,0453, 039,799 2,677,3442,706,640 Ratio of equity attributable to owners of parent to total share in yen: Net income (loss) Basic( ) Diluted( ) Equity attributable to owners of parent per share3, , , 3, , , , , , , , Cash expenditure271,900328,159268,421 234,850194,111253,581296,396274,862245,6 44 201,390 182,648 Depreciation and amortization267,454269,749200,477 200,377188,062202,334188,333176,180155,0 66 158,044170,663 Research and development expenses95,205106,202103,551 99,79295,40394,97894,14789,09882,80183,9 8285,154 Note: Solely for the convenience of readers, the Japanese yen amounts in this ANNUAL REPORT are translated into dollars at the rate of to $1, the approximate year-end Summary Bridgestone Corporation and Subsidiaries Years ended December 31($866 million), compared with billion in the previous fiscal year.