Transcription of Antigua and Barbuda MIGRATION PROFILES - UN DESA
1 Antigua and BarbudaStates parties to United Nations legal instrumentsYear ratified:Year ratified: - 1949 ILO MIGRATION for Employment Convention 1993 1989 Conv. on the Rights of the Child 1995 1951 Refugee Convention - 1990 UN Migrant Workers Convention 1995 1967 Refugee Protocol 2010 2000 Human Trafficking Protocol - 1975 ILO Migrant Workers Convention 2010 2000 Migrant Smuggling ProtocolPopulation estimates1990200020102013 Males ('000) 30 36 42 43 Females ('000) 32 41 46 47 Total ('000) 62 78 87 90 Percentage urban population 35 32 30 30 Percentage rural population 65 68 70 701985-901995-002005-102010-15 Average annual rate of rate of natural increase* net MIGRATION rate* net MIGRATION ('000)
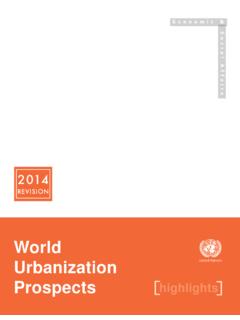
2 -8400* Per 1,000 populationProjected change in total population by component (x 1000)2015-202025-302035-402045-50 Total population at end of period 96 105 111 115 Population change during period5431 Annual rate of natural increase* net MIGRATION rate* * Per 1,000 populationProjected change in working-age (15-64) population (x 1000)2015-202025-302035-402045-50 Medium variant3111 Zero- MIGRATION variant3111 Difference0000 Development indicators (years are approximate for some indicators / countries)1990200020102013*Life expectancy at literacy rate (ages 15 and older).. 10 582 14 728 19 606 19 964 Human development index (HDI).. * 2013 or latest availableRemittances (years are approximate for some indicators / countries)1990200020102012*Inflows (millions of US dollars)13212422 Outflows (millions of US dollars)6222 Inflows as a share of GDP (%) * EstimateGDP per capita (PPP in thousands of US dollars) MIGRATION PROFILESPart I.
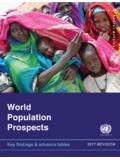
3 Global legal instruments related to international migrationPart II. Population indicatorsPart III. Development indicatorsCombined gross enrolment ratio in education (per cent) *Years HDI Human development index (HDI)Life expectancy at birth-30-20-10010201985-901995-002005-10 2010-15 Annual rate of natural increase*Crude net MIGRATION rate*-20246810122015-202025-302035-40204 5-50 Annual rate of natural increase*Crude net MIGRATION rate* Antigua and BarbudaInternational migrant stock by age and sex199020002013 MaleFemaleTotalMaleFemaleTotalMaleFemale Total0-4 576 655 1 231 868 995 1 863 1 013 1 171 2 1845-9 355 407 762 535 619 1 154 848 974 1 82210-14 259 296 555 718 831 1 549 818 933 1 75115-19 396 432 828 887 977 1 864 753 829 1 58220-24 624 648 1 272 1 038 1 088 2 126 1 017 1 081 2 09825-29 784 819
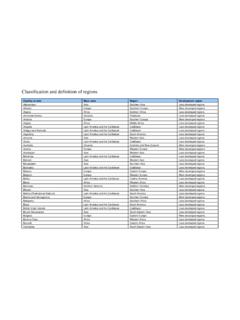
4 1 603 1 247 1 311 2 558 1 293 1 375 2 66830-34 671 734 1 405 1 447 1 598 3 045 1 461 1 590 3 05135-39 565 615 1 180 1 346 1 476 2 822 1 540 1 658 3 19840-44 415 408 823 1 092 1 087 2 179 1 524 1 546 3 07045-49 256 231 487 675 614 1 289 1 261 1 231 2 49250-54 220 211 431 428 415 843 909 926 1 83555-59 172 188 360 334 371 705 584 652 1 23660-64 181 213 394 264 316 580 403 485 88865+ 301 397 698 388 506 894 368 490 858 Total 5 775 6 254 12 029 11 267 12 204 23 471 13 792 14 941 28 733 Total population by age and sex, 2013 Native-born (males)Foreign-born (males)Native-born (females)Foreign-born (females) + stock by origin (2013)Migrant stock by destination (2013)Top 5 countries or areas of originTotalTop 5 countries or areas of destinationTotalGuyana 6 309 Dominica 4 624 BangladeshJamaica 3 889 United States Virgin IslandsUnited States of America 2 559 CanadaDominican Republic 1 740 Viet NamTotalRefugee population by origin (end 2012)Refugee population by destination (end 2012)Top 5 countries or areas of originTotalTop 5 countries or areas of destinationTotal0 00 00 00 00 0 Tertiary students by origin (2013)Tertiary students by destination (2013)
5 Top 5 countries or areas of originTotalTop 5 countries or areas of destinationTotalJamaica 29 United States of AmericaGuyana 27 CubaDominica 16 BarbadosUnited States of America 8 United Kingdom of Great Britain and Northern IrelandTrinidad and Tobago 4 Saint Lucia 84 Total 189 158 95 53 12 Total 507 TotalTotal 5 251 2 709 1 053 19 121 Total 53 083 Part IV. International migrant stocksMigrant stock by age and sex, 2013 United States of America 22 806 21 26464202460-45-910-1415-1920-2425-2930-3 435-3940-4445-4950-5455-5960-6465+Percen tage Native-born (males)Foreign-born (males)Native-born (females)Foreign-born (females)64202460-45-910-1415-1920-2425- 2930-3435-3940-4445-4950-5455-5960-6465+ Percentage MalesFemalesGDP per capita (PPP in USD): Gross domestic product converted to international dollars using purchasing power parity rates.
6 An international dollar has the same purchasing power over GDP as the dollar has in the United States. GDP at purchaser's prices is the sum of gross value added by all resident producers in the economy plus any product taxes and minus any subsidies not included in the value of the products. It is calculated without making deductions for depreciation of fabricated assets or for depletion and degradation of natural resources. Data are in current international dollars. Source: World Development Indicators - World Bank (2013).Population change during period:Total population change over a period, that is, the difference between the population at the end of the period and that at the beginning of the period.
7 Source: United Nations, Department of Economic and Social Affairs, Population Division (2013). World Population Prospects: The 2012 variant:The medium projection variant combines the medium fertility assumption together with normal-mortality and normal international MIGRATION assumptions and is a central reference for trends over the longer term that results from the probabilistic approach that simulates future fertility paths for each country. Source: United Nations, Department of Economic and Social Affairs, Population Division (2013). World Population Prospects: The 2012 variant: Under this assumption, the medium variant is modified so that international MIGRATION for each country is set to zero starting in 2010-2015.
8 Source: United Nations, Department of Economic and Social Affairs, Population Division (2013). World Population Prospects: The 2012 expectancy at birth: Number of years a newborn infant could expect to live if prevailing patterns of age-specific mortality rates at the time of birth stay the same throughout the infant s life. Source: United Nations, Department of Economic and Social Affairs, Population Division (2013). World Population Prospects: The 2012 literacy rate:The percentage of population aged 15 years and older who can both read and write with understanding a short simple statement on his/her everyday life. Generally, literacy also encompasses numeracy , the ability to make simple arithmetic calculations.
9 Source: United Nations Educational, Scientific and Cultural Organization. Institute for Statistics (2012). gross enrolment ratio in education: Total enrolment in a specific level of education, regardless of age, expressed as a percentage of the eligible official school-age population corresponding to the same level of education in a given school year. For the tertiary level, the population used is that of the five-year age group following on from the secondary school leaving. Source: United Nations Educational, Scientific and Cultural Organization. Institute for Statistics (2012). rural population: Rural population as a percentage of the total population.
10 Source: United Nations, Department of Economic and Social Affairs, Population Division (2012). World Urbanization Prospects: The 2011 rate of change: Average exponential rate of growth of the population over a given period. It is expressed as a percentage. Source: United Nations, Department of Economic and Social Affairs, Population Division (2013). World Population Prospects: The 2012 rate of natural increase: Crude birth rate minus the crude death rate. Represents the portion of population growth (or decline) determined exclusively by births and deaths. Source: United Nations, Department of Economic and Social Affairs, Population Division (2013). World Population Prospects: The 2012 net MIGRATION rate: The ratio of net MIGRATION during the year to the average population in that year.