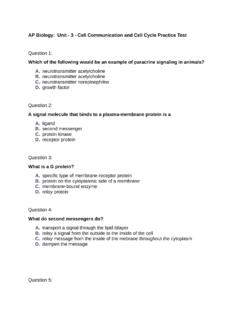
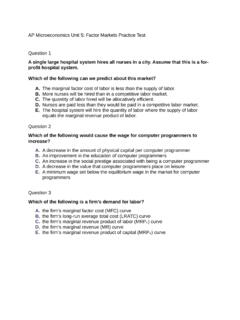
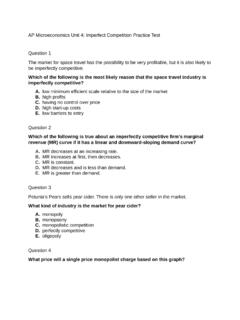
Transcription of AP Statistics: Unit – 5 - Sampling Distributions Practice Test
1 AP Statistics: Unit 5 - Sampling Distributions Practice TestQuestion 1 Let us suppose we have population data where the data are distributed distribution increasingly approximates the sample mean as the samplesize increases to infinity? 2A researcher wants to determine whether there is a significant linear relationshipbetween time spent meditating and time spent studying. What is the appropriatenull hypothesis for this study?A. 1 < 1B. 1 = 5C. 1 = 0D. 1 0E. 1 > 0 Question 3 What is the standard deviation of each (and every) sample mean? 4 The purpose of the t test is to do which of the following? the means of separate the significance of multiple the variance within a the ability of one variable to predict the relationship between five or more 5Y follows a chi-squared distribution with 6 degrees of freedom and X1 through Xnare independent standard normal , what is n? 6 The mean and standard deviation of a population are 200 and 20, size is 25.
2 What is the mean of the Sampling distribution? 7A statistic is an unbiased estimator of a parameter statistic is calculated from a random many samples, the values of the statistic are very close to the value of in a single sample, the value of the statistic is equal to the value of many samples, the values of the statistic are centered at the value of 8 These symbols represent the mean and standard deviation for which of thefollowing Distributions ? Sampling DistributionQuestion 9 These symbols represent the mean and standard deviation for which of thefollowing Distributions ? Sampling DistributionQuestion 10In the game of Scrabble, each player begins by drawing 7 tiles from a bagcontaining 100 tiles. There are 42 vowel, 56 consonants, and 2 blank tiles in thebag. Cait chooses an SRS of 7 tiles. Let p-hat be the proportion of vowels in hersample. Is the 10% condition met in this case? enough info to 11 The Gallup Poll asked a random sample of 1785 adults whether they attendedchurch during the past week.
3 Let p-hat be the proportion of people in the samplewho attended church. A newspaper report claims that 40% of all adults wentto church last week. Suppose this claim is true. What is the mean of the Sampling distribution of p-hat? 12 The Gallup Poll asked a random sample of 1785 adults whether they attendedchurch during the past week. Let p-hat be the proportion of people in the samplewho attended church. A newspaper report claims that 40% of all adults wentto church last week. Suppose this claim is true. Calculate the standard deviation of the Sampling distribution. (Check to see if the10% condition is met first) 13At a particular college, 78% of all students are receiving some kind of financialaid. The school newspaper selects a random sample of 100 students and 72% ofthe respondents say they are receiving some sort of financial aid. Which of thefollowing is true? is a population and 72% is a is a population and 78% is a is a parameter and 72% is a is a parameter and 78% is a statisticQuestion 14 Why do we randomly select our samples?
4 We don't get the same answers from eliminate confounding resultsQuestion 15 The population group of people, objects or events being of the group being whole 16 What does this symbol represent? sampleQuestion 17 The Sampling distribution of a statistic repeated samples and finding a distribution of values taken by a statistic in all possible samples of the samesample size from the same way that sample results differ from each distribution of values in a sample of size 18If you had to choose a "best statistic" to describe a population, which of thefollowing would be best? bias, high bias, high bias, low bias, low variabilityQuestion 19A statistic is biased value of the statistic from any sample is NOT equal to the value of the statistic from any sample IS equal to the mean of the Sampling distribution is NOT equal to the true value of mean of the Sampling distribution IS equal to the