Transcription of APPLICATION OF FISHBONE DIAGRAM TO DETERMINE THE …
1 Ilie G. and. Ciocoiu APPLICATION OF FISHBONE DIAGRAM TO DETERMINE THE RISK OF AN EVENT WITH MULTIPLE causes MANAGEMENT RESEARCH AND PRACTICE Vol. 2 Issue 1 (2010) p: 1)20 1 Management Research and Practice Volume 2, Issue 1 / March 2010 eISSN 2067- 2462 APPLICATION OF FISHBONE DIAGRAM TO DETERMINE THE RISK OF AN EVENT WITH MULTIPLE causes Gheorghe ILIE 1, Carmen Nadia CIOCOIU 2 1 UTI Grup SRL, Soseaua Oltenitei , Bucharest, Romania, 2 Academy of Economic Studies, Piata Romana, 6, Bucharest, Romania, Abstract FISHBONE DIAGRAM (also known as Ishikawa DIAGRAM ) was created with the goal of identifying and grouping the causes which generate a quality problem. Gradually, the method has been used also to group in categories the causes of other types of problems which an organization confronts with.
2 This made FISHBONE DIAGRAM become a very useful instrument in risk identification stage. The article proposes to extend the applicability of the method by including in the analysis the probabilities and the impact which allow determining the risk score for each category of causes , but also, of the global risk. The practical APPLICATION is realized to analyze the risk loosing specialists . Keywords: FISHBONE DIAGRAM , global risk, probability, impact. 1. Introduction The FISHBONE DIAGRAM (also called the Ishikawa DIAGRAM ) is a tool for identifying the root causes of quality problems. It was named after Kaoru Ishikawa, a Japanese quality control statistician, the man who pioneered the use of this chart in the 1960's (Juran, 1999). The FISHBONE DIAGRAM is an analysis tool that provides a systematic way of looking at effects and the causes that create or contribute to those effects.
3 Because of the function of the FISHBONE DIAGRAM , it may be referred to as a cause-and-effect DIAGRAM (Watson, 2004). FISHBONE (Ishikawa) DIAGRAM mainly represents a model of suggestive presentation for the correlations between an event (effect) and its multiple happening causes . The structure provided by the DIAGRAM helps team members think in a very systematic way. Some of the benefits of constructing a FISHBONE DIAGRAM are that it helps DETERMINE the root causes of a problem or quality characteristic using a structured approach, encourages group participation and utilizes group knowledge of the process, identifies areas where data should be collected for further study (Basic Tools for Process Improvement, 2009). The design of the DIAGRAM looks much like the skeleton of a fish. The representation can be simple, through bevel line segments which lean on an horizontal axis, suggesting the distribution of the multiple causes and sub- causes which produce them, but it can also be completed with qualitative and quantitative appreciations, Ilie G.
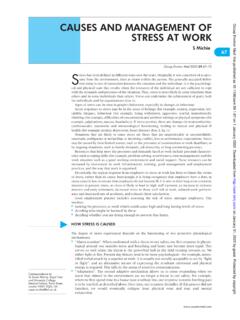
4 And. Ciocoiu APPLICATION OF FISHBONE DIAGRAM TO DETERMINE THE RISK OF AN EVENT WITH MULTIPLE causes MANAGEMENT RESEARCH AND PRACTICE Vol. 2 Issue 1 (2010) p: 1)20 2 Management Research and Practice Volume 2, Issue 1 / March 2010 eISSN 2067- 2462 with names and coding of the risks which characterizes the causes and sub- causes , with elements which show their succession, but also with other different ways for risk treatment. The DIAGRAM can also be used to DETERMINE the risks of the causes and sub- causes of the effect, but also of its global risk (Ciocoiu, 2008). Usually, the analysis after FISHBONE DIAGRAM continues with other representation and establishing treatment priorities methods. 2. EMENTING FISHBONE DIAGRAM To implement FISHBONE DIAGRAM is used the logic scheme in Figure 1. A special attention must be given to problem identification and its risk formalization.
5 - are identified problems, symptoms, consequences, risks - interview and consulting techniques are used - damages dimensions - chronological elements, events - treatment priorities - main causes are detailed - in Boards of Directors, conferences or consultations - the DIAGRAM s acceptance is decided by the top management through an official document FIGURE 1 - LOGIC SCHEME OF FISHBONE DIAGRAM IMPLEMENTATION (ILIE, 2009) LOOSING SPECIALISTS (5) YES NO PROBLEM IDENTIFICATION PROBLEM FORMALIZATION IDENTIFYING MAIN AND SECONDARY causes PRIORITY CRITERIAS ARE ESTABLISHED DIAGRAM ANALYSE IS IT ACCEPTED? COMPLETION OF FISHBONE DIAGRAM ACCEPTED DIAGRAM (7) (6) (4) (3) (2) (1) Ilie G. and. Ciocoiu APPLICATION OF FISHBONE DIAGRAM TO DETERMINE THE RISK OF AN EVENT WITH MULTIPLE causes MANAGEMENT RESEARCH AND PRACTICE Vol.
6 2 Issue 1 (2010) p: 1)20 3 Management Research and Practice Volume 2, Issue 1 / March 2010 eISSN 2067- 2462 The problem itself must be a desired or non-desired event characterized by risk and which must be treated (decreased) or exploited (capitalized). For the problem solved using FISHBONE DIAGRAM , it must fulfill the following conditions: it must be characterized by risk (R = p I), meaning that the probability of occurrence and its impact can be determined; it must be a management objective with operational valence; the causes producing it must be characterized by probability, possibility or frequency of occurrence; in turn, main causes must be also considered as effects (secondary or of second order) and sub- causes , named side-effects and which represent the causes of the secondary effects, must fulfill the same conditions as the main causes ; there must not exist bijective correlations, meaning the effect must not turn into its cause, regardless the positioning on the DIAGRAM .
7 Identifying main and secondary causes and their formalization must fulfill the same conditions as the problem identification and formalization, plus the following: a priority criteria or a certain sequence in time (chronology) or a certain probability, possibility or frequency of occurrence can be identified; main causes may or may not have one or more secondary causes ; if the question, the belonging of these causes can be identified: endogenous to the system of which the effect characterized by risk belongs or exogenous to the system (belonging to the environment); the number of main and secondary causes must be reasonable, usually not over 7-9 for main causes and 2-3 for the secondary causes of a main cause; main and secondary causes must be representative and should allow monitoring or even management (can be sustained or fined through measures); names given must be representative and suggestive for the relation cause-effect, and at the same time it should be able to be characterized by risks which enroll in the cause s relevance.
8 Completion, the analysis as representativeness and relevance and its DIAGRAM acceptance represent a team-work which needs to take into consideration the objectivity of the analysis, its phenomenological representativeness (of the process), localization inside the achievement and representation criteria, coding possibility and establishing the exogenous or endogenous membership of its elements (Ilie, 2009). Ilie G. and. Ciocoiu APPLICATION OF FISHBONE DIAGRAM TO DETERMINE THE RISK OF AN EVENT WITH MULTIPLE causes MANAGEMENT RESEARCH AND PRACTICE Vol. 2 Issue 1 (2010) p: 1)20 4 Management Research and Practice Volume 2, Issue 1 / March 2010 eISSN 2067- 2462 A lopsided DIAGRAM can indicate an over-focus in one area, a lack of knowledge in other areas, or it can simply indicate that the causes are focused in the denser area.
9 A sparse DIAGRAM may indicate a lack of general understanding of the problem or just a problem with few possible causes (Straker). The repartition of the causes and sub) causes on the DIAGRAM must meet some relevance, membership or timeline criteria, but they can be put in any preference order or even random (Ciocoiu, 2008). After accepting the DIAGRAM , which must be stated in a decisional document (decision, minute, agreement etc.), follows the risk analyze of the elements in the DIAGRAM and then to the establishment of a plan for treatment or risk operation of the components ( causes ) and of the risk (global) of the characterized event (the effect). 3. ANALYSIS OF LOOSING SPECIALISTS DIAGRAM For the APPLICATION presented in this paper was chosen as the problem the fact of loosing specialists , an undesirable event with negative connotations.
10 The risk assigned to the studied event will be actually named the risk of loosing specialists . This risk fulfills all conditions of analytical element of the process developed inside an organization, regardless of its profile, and must not be confused with lost specialist value number. The number of lost specialists represents a performance indicator and it can be taken into consideration when analyzing the process itself. The difference between the risk of loosing specialists and the number of lost specialists (binding in a certain period of time: one year, during the functioning period of an organization, during a contract period etc.) is that the number of specialists represents a static performance element, while the risk represents the dynamic of the phenomenon through the probability distribution of the effect occurrence, but also the impact which this effect has on the organization or on the process it belongs to.