Transcription of Applications of Fluorescence Spectroscopy
1 National Level Workshop on Spectroscopic Techniques in Structural Elucidation Journal of Chemical and Pharmaceutical Sciences ISSN: 0974-2115 JCHPS Special Issue 5: Page 18 Applications of Fluorescence Spectroscopy Kommu Naresh Lecturer, Government Degree College, Bichkunda, Nizamabad, Telangana. *Corresponding author E- mail: ABSTRACT Fluorescence Spectroscopy is a rapid, sensitive method for characterizing molecular environments and events. Fluorescence Spectroscopy is a type of electromagnetic Spectroscopy which analyzes Fluorescence from a sample. In this Spectroscopy generally light passes issued by the excitation source through a unified candidate or waves and collides with the sample of fluorophore, the sample absorbs part of the incident light and Fluorescence is happening in the sample. There are a relatively small number of compounds that have a characteristic Fluorescence such as aromatic hydrocarbons.
2 This has contributed to the use of the spectroscope successfully in the detection of many of organic compounds, aromatic numerous active substances in drugs in the field of research chemicals, biochemical, and medical analysis of organic compounds. A great deal of research has been done on the development of new fluorescent dyes for visualizing finger prints with a laser in the area of forensic science. Fluorescence has also been applied extensively to questioned-document analysis, principally in characterization of inks. Other types of evidence that use fluorometric analysis include drugs, glass, petroleum products, and biological samples. Fluorescence Spectroscopy may be an excellent diagnostic as well as excellent research tool in medical microbiology field with high sensitivity and specificity. This article presents a brief overview of the theory of Fluorescence Spectroscopy , together with some examples of Applications of this technique in food analysis, forensic science, medical diagnosis, medical science etc.
3 Key words: Fluorescence Spectroscopy , Fluorometry, analysis, spectrofluorometer 1. INTRODUCTION Spectroscopy has made an outstanding contribution to the present state of atomic and molecular chemistry and lasers have always played an important role in this area. During the past 20 years there has been a remarkable growth in the use of Fluorescence in the biological sciences. Fluorescence Spectroscopy and time-resolved Fluorescence are considered to be primarily research tools in biochemistry and biophysics. Fluorescence is the molecular absorption of light energy at one wavelength and its nearly instantaneous re-emission at another, usually longer, wavelength. Fluorescent compounds have two characteristic spectra: an excitation spectrum (the wavelength and amount of light absorbed) and an emission spectrum (the wavelength and amount of light emitted). These spectra are often referred to as a compound's Fluorescence signature or fingerprint.
4 No two compounds have the same Fluorescence signature. It is this principle that makes fluorometry a highly specific analytical technique. Fluorometry is the measurement of Fluorescence . The instrument used to measure Fluorescence is called a fluorometer or fluorimeter. A fluorometer generates the wavelength of light required to excite the analyte of interest; it selectively transmits the wavelength of light emitted, then it measures the intensity of the emitted light. The emitted light is proportional to the concentration of the analyte being measured. Fluorometers employ monochromators (a spectrofluorometer), optical filters (a filter fluorometer), or narrow band light sources like LED s or lasers to select excitation and emission wavelengths. Fluorometry is chosen for its extraordinary sensitivity, high specificity, simplicity, and low cost as compared to other analytical techniques.
5 Fluorometry is ordinarily more sensitive than absorbance measurements. It is a widely accepted and powerful technique that is used for a variety of environmental, industrial, medical diagnostics, DNA sequencing, forensics, genetic analysis, and biotechnology Applications . It is a valuable analytical tool for both quantitative and qualitative analysis. 2. PRINCIPLE OF Fluorescence Spectroscopy Fluorescence and phosphorescence are photon emission processes that occur during molecular relaxation from electronic excited states. These photonic processes involve transitions between electronic and vibrational states of polyatomic fluorescent molecules (fluorophores). Fluorophores play the central role in Fluorescence Spectroscopy . Fluorophores are the components in molecules that cause them to Fluorescence . Majorly fluorophores are the molecule which contain aromatic rings such as Tyrosine, Tryptophan, Fluorescein etc.
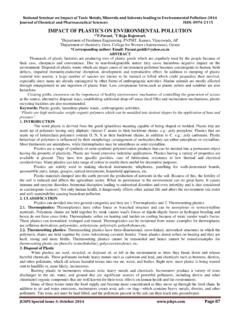
6 National Level Workshop on Spectroscopic Techniques in Structural Elucidation Journal of Chemical and Pharmaceutical Sciences ISSN: 0974-2115 JCHPS Special Issue 5: Page 19 The Jablonski diagram (Figure 1) offers a convenient representation of the excited state structure and the relevant transitions. Molecules that have become electronically excited subsequent to the absorption of visible (400~700nm), UV (200~400nm), or NIR(700~1100 nm) radiation. Excitation process to the excited state from the ground state is very fast, on the order of 10 15 s. After excitation, the molecule is quickly relaxed to the lowest vibrational level of the excited electronic state. This rapid vibrational relaxation process occurs on the time scale of femto seconds to picoseconds. Fluorescence emission occurs as the fluorophore decay from the singlet electronic excited states to an allowable vibrational level in the electronic ground state.
7 The Fluorescence excitation and emission spectra reflect the vibrational level structures in the ground and the excited electronic states, respectively. Fluorescence : Prompt Fluorescence : S1 S0 + h The release of electromagnetic energy is immediate or from the singlet state. Delayed Fluorescence : S1 T1 S1 S0 + h This results from two intersystem crossings, first from the singlet to the triplet, then from the triplet to the singlet. Phosphorescence: T1 S0 + h Delayed release of electromagnetic energy from the triplet state. Diagram Types of Fluorescence and emission processes: Stokes Fluorescence is the reemission of less energetic photons, which have a longer wavelength than the absorbed photons. Stokes shift is the rapid decay to the lowest vibrational level of S1. Dilute gases at high temperature emission at shorter wavelengths than those of absorption occur. This is called Anti-Stokes Fluorescence .
8 It occurs when thermal energy is added to an excited state or a compound has many highly populated vibrational energy levels. Resonance Fluorescence is the reemission of photons possessing the same energy as the absorbed photons. This type of Fluorescence is never observed in solution because of solvent interactions, but it does occur in gases and crystals. 3. INSTRUMENTATION OF SPECTROFLUOROMETER: diagram of a spectrofluorometer National Level Workshop on Spectroscopic Techniques in Structural Elucidation Journal of Chemical and Pharmaceutical Sciences ISSN: 0974-2115 JCHPS Special Issue 5: Page 20 A diagram of a typical fluorimeter is shown in Figure 2. It consists of a continuous ozone-free xenon lamp generating a continuum of visible and ultra-violet light, a monochromator to select the required wavelength for excitation, a sample compartment, and a second monochromator coupled with a photomultiplier tube (PMT) to analyze the Fluorescence signal.
9 The grating in the excitation and emission monochromator can disperse light from 200 to 900 nm. The entrance and exit slits of each monochromator control the intensity and wavelength spread (band pass) of the light. Illumination from the Xenon-lamp is collected by an elliptical mirror and directed toward the entrance slit of the excitation monochromator. The excitation monochromator selectively delivers a narrow band of wavelengths of excitation light that strikes the sample. A portion of the incident light is absorbed by the sample, and some of the molecules in the sample fluoresce. The emitted light enters the emission monochromator, which is positioned at 90 angle with respect to excitation light path in order to minimize the risk of transmitted or reflected incident light reaching the detector. No monochromator is perfect and it will transmit some stray light, that is, light with other wavelength than targeted.
10 The emitted light is transmitted in a narrow range of centered about the specified emission wavelength and exits through the adjustable slits, and finally striking the detector. The signal is amplified and generates a voltage that is proportional to the measured emitted intensity. The right angle geometry is used when the sample is transparent. There is geometry for collecting Fluorescence , known as front faced geometry. In this geometry the Fluorescence is collected from the sample from the same surface at which the sample is illuminated by excitation light. The front face geometry is used primarily when the sample is opaque or solid. A Fluorescence spectrum of a sample is recorded by scanning the emission monochromator for a constant wavelength of the excitation light ( ex). Similarly, an excitation spectrum is acquired by scanning the excitation monochromator at a fixed emission wavelength ( em). The source light has different intensities at all wavelengths, and it may vary over time during each experiment or between each experiment.