Transcription of Applied Fixed Income Risk Modeling - Northfield
1 1 Applied Fixed Income Risk ModelingSuccesses ExperiencesNavin SharmaVP, Director of Fixed Income Risk Management and AnalyticsOppenheimerFunds, s 18thAnnual Research ConferenceJuly 20052 Risk Management at OFI Fixed Income Risk Management and Analytics group Responsible for Fixed Income risk management at OppenheimerFunds both retail and institutional. Responsible for conducting fund complex-level risk management analyses and reporting all funds risks to: Senior management OppenheimerFunds boards As such, we have three sets of audiences: The fund managers and their analysts Senior management and the boards Sales, marketing, product management, Request-for-Proposal, and other departments3 Risk System Goals An ex-anteportfolio (or trade) evaluation system.
2 Not an ex-postportfolio decomposition/reporting system. Use to structure efficient, active portfolios Relate risk factors to portfolio returns and use this relationship to reveal risks in active portfolios Also: Counterparty risk analyses Senior Management-level fund complex analyses4 Risk System Goals Structure efficient, active portfolios along dimensions of outperformance Prove consistency of portfolio manager s risk/reward beliefs Quantifying intended tilts Evaluating risk impact of potential trades Hedging tool Assisting in active benchmarks construction Risk Budgeting Reveal and manage risks in active portfolios Reveal unintentional marginal risks Predict portfolio and benchmark risks Provide quantitative insights into past performance5 Risk System Goals Main risk measures include Prediction of portfolio and benchmark variances Active risk (tracking error)
3 Value-at-Risk Marginal tracking error Incremental tracking error Component tracking error6 What s a Fixed Income risk manager to do? We own or have bought over the years: domestics, foreigns, treasuries, high yield, [very] emerging markets debt, local EM, USD EM, swaps, swaptions, cross-currency structured notes, local EM CDS, futures, CDX indices, ABS, CAT bonds, currency forwards and options, and sometimes funky structured Income risk models 2002 Available choices in 2002 Inhouse model, Wilshire, Lehman Point, CMS BondEdge, Citigroup Yield Book Tracking Error In a nutshell: None but oneof the above models captured the risks of mostfixed Income securities well!8 Fixed Income risk models 2002 Inhouse model historical, simple covariance matrix (linear).
4 Not a black-box. Wilshire factor-based. Citi indices needs, some FI non-linearity concerns, support staff size vs peers. Good software design for access and downloads. Lehman lacked its current capabilities, non-PCA. Different customer paradigm than Yield Book. CMS BondEdge lacked full risk Modeling capabilities, esp MBS. Good software engineering. Citigroup Yield Book PCA-based with Monte Carlo approach capturing approach was:In general, index yields and calculate spread beta to covariance matrix of weights and to predicted return price volatility via where yMDPP ()()yMDPP 222 XXT ===++=2ij222221221211212membermatrix covariancereturn holdings portfolio of weights 2pipwwwww s'y.
5 10 Regression/factor approachExample: Wilshire excess return against shifts in YCExcess Return = factor return1x sensitivity + factor return2x sensitivity + factor return3x sensitivity + residual returntoparallel to parallel to steepening to steepening to curve to curveshift ( 1) shift (eff. dur.) shift ( 2) shift shift ( 3) residual return against shifts in spreads ( sector, quality, prepayment, etc) matrix constructed from historical factor returns to predicted return volatilityikrbjfirfbfbariikkiikikiiiretu rn residual factor y tosensitivit factor ofreturn holding ofreturn excess i11====++++= KIn general,11 Simulation ApproachExample.
6 Yield factors for each security risk factors by their principal matrix of the principal the distribution to obtain changes in the risk factors (risk factor PC moves) component moves to individual bond returns Interpolation on pre-calculated scenario analysis results for returns due to yield curve moves Risk duration based calculations for risk factors such as volatilities and returns of all securities to obtain portfolio return Comparison RecapK+ + + + = spreadtorcurvesteepeningparalleldydPdydP dydPdydPydydPPPPsec4321return excess1 1. Repeated draws from PC multivariate normal distribution2. Run MC scenario analysis using set of PC from above3. Aggregate to obtain price distribution Simple covariance-based:Factor-based:Simulation -based:13 Fixed Income risk models 2002 We chose Yield Book ( Tracking Error ) because: Monte Carlo approach provided best estimate of Fixed Income securities returns we buy lots of non-linear stuff!
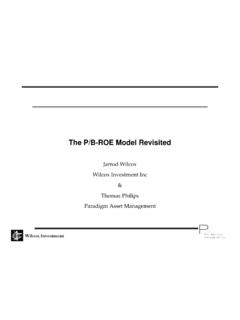
7 Forward-looking via scenario analysis Portfolios priced using security-specific models Do not impose a linear relationship hence analyze securities with non-normal return distributions. Securities without sufficient price history can also be Income risk models 2002 Pricing, hedging, and risk analysis of all securities can be done with the same models (eliminating inconsistencies between assumptions). Extensive and clean data sets (Citi indices) Yield Book has a long track record (since 1991) Used internally at Citi by trading and sales (robust analytics tried and tested)15 Example of returns non-linearity: Citi Mortgage IndexDistribution of 10,000 paths using Monte Carlo simulation over aone-month horizon16 Simulation ApproachExample: Yield risk factors for each asset class (security type or grouping) PCA on covariance matrices of each security correlation matrix between PC s ( , simulate the correlated occurrences of approximately 800 market variables) from distribution in 3) to obtain ( ) change in PC to bond space ( , map PC factors to market risk factors; two examples below)Yield Curve: a.
8 Determine that a equates to an 80 bpmove in the 10-year tsy Perform horizon scenario analysis (via Monte Carlo simulation) to obtain individual bond returns ( estimate the returns for each bond for an 80 bpmove in the 10-year tsy rate).Spreads: a. Determine that a move in the spread PCcorresponds to a 100 bpchange in the spread for a short maturity, AA, industrial, US corporate bond. b. Perform horizon scenario analysis for each such bond to obtain individual bond spread returns ( , estimate the bond s return for a 100 bpchange for a short maturity, AA, industrial, US corporate bond).PC 2PC 2 217 Simulation ApproachExample: Yield Book (contd.) of the distribution of portfolio returns -P&Ls due to interest-rate and volatility shocks are obtained via Yield Book s scenario analytics engine returns of all securities to construct portfolio pricedistribution Also: The Yield Book datasets provide options to use either three-year or two-year of monthly data points for the PC correlation matrix.
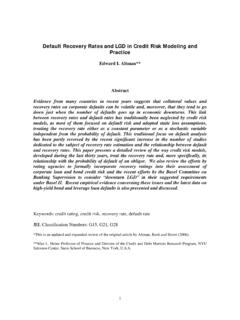
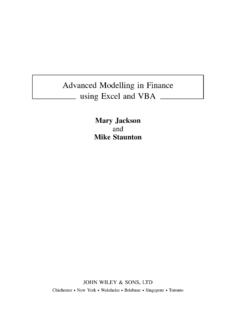
9 The covariance is estimated from Citigroup s historical Fixed - Income Risk PCsUS 1US 2US 3 EMU 1 EMU 2 EMU 3UK 1UK 2UK 3 YEN 1 YEN 2 YEN 3US : High Correlation (magnitude of correlation > )Green: Low Correlation (magnitude of correlation greater than , less than )Light Blue: Very low correlation (magnitude of correlation less than )Correlations Between Yield Curve Principal Components19PC1 move-80-60-40-2002040608005101520253035 Term (YR)-2 sigma-1 sigma0 sigma+1 sigma+2 sigmaCurve Risk PCsPrincipal Component #1 of the UST curve movements20 Curve Data for Each Market Maturity Country Curve 3m 6m 1Y 2Y 3Y 4Y 5Y 6Y 7Y 8Y 9Y 10Y 12Y 15Y 20Y 25Y 30Y On The Run x x x x x x x x x x x Model x x x x x x x x x x x x x x x x Swap x x x x x x x x x x x x x x x US Agency x x x x x x x x x x x x Model x x x x x x x x x x x x x x x x EMU Swap x x x x x x x x x x x x x x Model x x x x x x x x x x x x x x Japan Swap x x x x x x x x x x x x Model x x x x x x x x x x x x x x x x UK Swap x x x x x x x x x x x x x x x x Model x x x x x x x x x x x x x x x x Canada Swap x x x x x x x x x x x x Model x x x x x x x x x x x x x x x Denmark
10 Swap x x x x x x x x x x x x Model x x x x x x x x x x x x x Switzerland Swap x x x x x x x x x x x x x x x x Model x x x x x x x x x x x x x Sweden Swap x x x x x x x x x x x x Model x x x x x x x x x Australia Swap x x x x x x x x x Poland Swap* x x x x x x x x x x x S. Africa Swap* x x x x x x x x x x x x x x Czech Swap* x x x x x x x x x Norway Model x x x x x x x x New Zealand Swap* x x x x x x x x x x Hong Kong Swap* x x x x x x x x x x South Korea Swap* x x x x x x x x x x Thailand Model x x x x x x x x x Singapore Model x x x x x x x Hungary Model x x x x x x x Yield Curve risk factors21 Return vs.