Transcription of Approximate Percentage of Corn Located in …
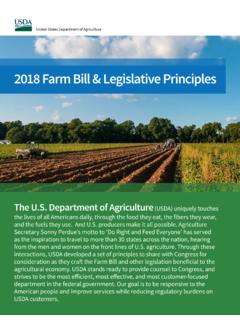
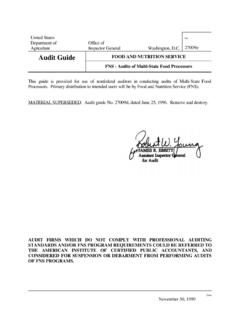
1 3210115343426264711118744213161212124210 126674130821711102030405060708090100 Iowa (17)Illinois (15)Nebraska (12)Minnesota (10)Indiana (7)South Dakota (5)Kansas (4)Ohio (4)Wisconsin (4)Michigan (3)Missouri (3)North Dakota (3)Texas (2)Colorado (1)Kentucky (1)Pennsylvania (1) United StatesCrop production percentages and associated drought intensitiesApproximate Percentage of Corn Located in Drought *June 12, 2018 Percent in Moderate Drought (D1)Percent in Severe Drought (D2)Percent in Extreme Drought (D3)Percent in Exceptional Drought (D4)* Drought percentages were calculated from Monitor (USDM) data for the above information on the USDM is available contributions to national production(percentages in parentheses) are based upon NationalAgricultural Statistics Service (NASS) 5-year averagesfrom 2006-2010.
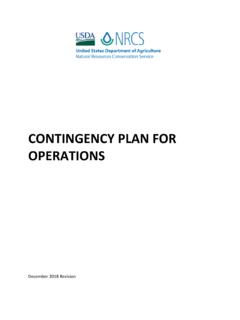
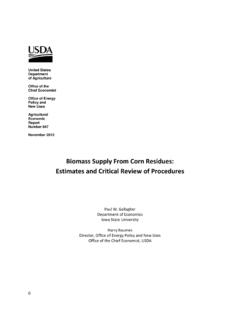
2 More information on NASS data canbe found at Weather AssessmentsWorld Agricultural Outlook Board43369131516151512101012141011954334 4678101011131315161716151088888888988810 1011111123334422222121111221234455443444 4444444444441111111111122233333332211111 111111020406080100 Jun 13 2017 Jun 20 2017 Jun 27 2017 Jul 4 2017 Jul 11 2017 Jul 18 2017 Jul 25 2017 Aug 1 2017 Aug 8 2017 Aug 15 2017 Aug 22 2017 Aug 29 2017 Sep 5 2017 Sep 12 2017 Sep 19 2017 Sep 26 2017 Oct 3 2017 Oct 10 2017 Oct 17 2017 Oct 24 2017 Oct 31 2017 Nov 7 2017 Nov 14 2017 Nov 21 2017 Nov 28 2017 Dec 5 2017 Dec 12 2017 Dec 19 2017 Dec 26 2017 Jan 2 2018 Jan 9 2018 Jan 16 2018 Jan 23 2018 Jan 30 2018 Feb 6 2018 Feb 13 2018 Feb 20 2018 Feb 27 2018 Mar 6 2018 Mar 13 2018 Mar 20 2018 Mar 27 2018 Apr 3 2018 Apr 10 2018 Apr 17 2018 Apr 24 2018 May 1 2018 May 8 2018 May 15 2018 May 22 2018 May 29 2018 Jun 5 2018 Jun 12 2018 PercentDate Moderate or more intense drought (D 1+) Severe or more intense drought (D2+)
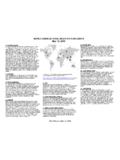
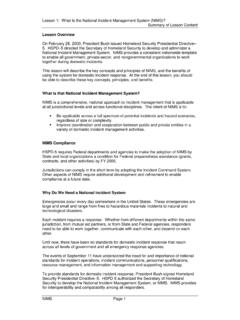
3 Extreme or more intense drought (D3+) Exceptional drought (D4)United States Corn Areas Located in DroughtAgricultural Weather AssessmentsWorld Agricultural Outlook Board14213312218145128185121721016213382 7301721211102030405060708090100 Illinois (14)Iowa (14)Minnesota (9)Indiana (8)Nebraska (8)Ohio (7)Missouri (6)North Dakota (5)South Dakota (5)Arkansas (4)Kansas (4)Michigan (3)Mississippi (3)Kentucky (2)Louisiana (2)North Carolina (2)Tennessee (2)Wisconsin (2) United StatesCrop production percentages and associated drought intensitiesApproximate Percentage of Soybeans Located in Drought *June 12, 2018 Percent in Moderate Drought (D1)Percent in Severe Drought (D2)Percent in Extreme Drought (D3)Percent in Exceptional Drought (D4)* Drought percentages were calculated from Monitor (USDM) data for the above information on the USDM is available contributions to national production(percentages in parentheses)
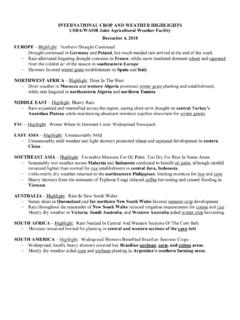
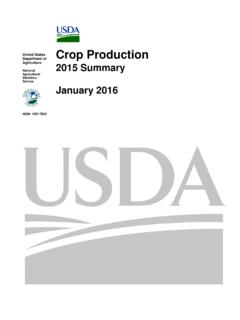
4 Are based upon NationalAgricultural Statistics Service (NASS) 5-year averagesfrom 2006-2010. More information on NASS data canbe found at Weather AssessmentsWorld Agricultural Outlook Board64469121416151612111014151011955445 6911121411111212141517161596766666787779 1011111123334522232111112441222344321122 2222222222231111111111111020406080100 Jun 13 2017 Jun 20 2017 Jun 27 2017 Jul 4 2017 Jul 11 2017 Jul 18 2017 Jul 25 2017 Aug 1 2017 Aug 8 2017 Aug 15 2017 Aug 22 2017 Aug 29 2017 Sep 5 2017 Sep 12 2017 Sep 19 2017 Sep 26 2017 Oct 3 2017 Oct 10 2017 Oct 17 2017 Oct 24 2017 Oct 31 2017
5 Nov 7 2017 Nov 14 2017 Nov 21 2017 Nov 28 2017 Dec 5 2017 Dec 12 2017 Dec 19 2017 Dec 26 2017 Jan 2 2018 Jan 9 2018 Jan 16 2018 Jan 23 2018 Jan 30 2018 Feb 6 2018 Feb 13 2018 Feb 20 2018 Feb 27 2018 Mar 6 2018 Mar 13 2018 Mar 20 2018 Mar 27 2018 Apr 3 2018 Apr 10 2018 Apr 17 2018 Apr 24 2018 May 1 2018 May 8 2018 May 15 2018 May 22 2018 May 29 2018 Jun 5 2018 Jun 12 2018 PercentDate Moderate or more intense drought (D 1+) Severe or more intense drought (D2+) Extreme or more intense drought (D3+) Exceptional drought (D4)United States Soybean Areas Located in DroughtAgricultural Weather AssessmentsWorld Agricultural Outlook BoardAgricultural Weather AssessmentsWorld Agricultural Outlook Board38213431422351112911371041126627931 1513721245310101731194129114727703352546 3312631758108421102030405060708090100 Texas (9)Missouri (6)Kansas (5)Nebraska (5)Oklahoma (5)South Dakota (5)Kentucky (4)Montana (4)North Dakota (4)California (3)Idaho (3)Minnesota (3)Pennsylvania (3)Tennessee (3)Wisconsin (3)
6 Alabama (2)Arkansas (2)Colorado (2)Iowa (2)Michigan (2)New York (2)Ohio (2)Oregon (2)Virginia (2)Wyoming (2)Georgia (1)Mississippi (1)Nevada (1)North Carolina (1)Utah (1)Washington (1)West Virginia (1) United StatesCrop production percentages and associated drought intensitiesApproximate Percentage of Hay Located in Drought *June 12, 2018 Percent in Moderate Drought (D1)Percent in Severe Drought (D2)Percent in Extreme Drought (D3)Percent in Exceptional Drought (D4)* Drought percentages were calculated from Monitor (USDM) data for the above information on the USDM is available contributions to national production(percentages in parentheses) are based upon NationalAgricultural Statistics Service (NASS) 2012 Census ofAgriculture data.
7 More information on NASS data canbe found at 13 2017 Jun 20 2017 Jun 27 2017 Jul 4 2017 Jul 11 2017 Jul 18 2017 Jul 25 2017 Aug 1 2017 Aug 8 2017 Aug 15 2017 Aug 22 2017 Aug 29 2017 Sep 5 2017 Sep 12 2017 Sep 19 2017 Sep 26 2017 Oct 3 2017 Oct 10 2017 Oct 17 2017 Oct 24 2017 Oct 31 2017 Nov 7 2017 Nov 14 2017 Nov 21 2017 Nov 28 2017 Dec 5 2017 Dec 12 2017 Dec 19 2017 Dec 26 2017 Jan 2 2018 Jan 9 2018 Jan 16 2018 Jan 23 2018 Jan 30 2018 Feb 6 2018 Feb 13 2018 Feb 20 2018 Feb 27 2018 Mar 6 2018 Mar 13 2018 Mar 20 2018 Mar 27 2018 Apr 3 2018 Apr 10 2018 Apr 17 2018 Apr 24 2018 May 1 2018 May 8 2018 May 15 2018 May 22 2018 May 29 2018 Jun 5 2018 Jun 12 2018 PercentDate Moderate or more intense drought (D 1+) Severe or more intense drought (D2+) Extreme or more intense drought (D3+) Exceptional drought (D4)
8 United States Hay Areas Located in DroughtAgricultural Weather AssessmentsWorld Agricultural Outlook BoardAgricultural Weather AssessmentsWorld Agricultural Outlook Board30273181441818614322341121363112546 3910141189127222253796334881647432850623 2238141004110024425102030405060708090100 Texas (12)Kansas (7)Nebraska (7)California (6)Oklahoma (5)Iowa (4)Missouri (4)South Dakota (4)Wisconsin (4)Colorado (3)Idaho (3)Kentucky (3)Minnesota (3)Montana (3)Arkansas (2)Florida (2)New Mexico (2)New York (2)North Dakota (2)Pennsylvania (2)Tennessee (2)Virginia (2)Alabama (1)Arizona (1)Georgia (1)Illinois (1)Michigan (1)Mississippi (1)Ohio (1)Oregon (1)Washington (1)Wyoming (1) United StatesAnimal inventory percentages and associated drought intensitiesApproximate Percentage of Cattle Located in Drought *June 12, 2018 Percent in Moderate Drought (D1)Percent in Severe Drought (D2)Percent in Extreme Drought (D3)Percent in Exceptional Drought (D4)
9 * Drought percentages were calculated from Monitor (USDM) data for the above information on the USDM is available contributions to the total national inventory(percentages in parentheses) are based upon NationalAgricultural Statistics Service (NASS) 2012 Census ofAgriculture data. More information on NASS data canbe found at 13 2017 Jun 20 2017 Jun 27 2017 Jul 4 2017 Jul 11 2017 Jul 18 2017 Jul 25 2017 Aug 1 2017 Aug 8 2017 Aug 15 2017 Aug 22 2017 Aug 29 2017 Sep 5 2017 Sep 12 2017 Sep 19 2017 Sep 26 2017 Oct 3 2017 Oct 10 2017 Oct 17 2017 Oct 24 2017 Oct 31 2017 Nov 7 2017 Nov 14 2017 Nov 21 2017 Nov 28 2017 Dec 5 2017 Dec 12 2017 Dec 19 2017 Dec 26 2017 Jan 2 201