Transcription of Archived Lecture Notes #10 - Phase Equilibria and Phase ...
1 LN 10 Introduction to Solid State Chemistry Lecture Notes No. 10 Phase Equilibria AND Phase DIAGRAMS * * * * * * * * * * * * * * * * * * * * * * * * * * * * * * * * * * * * * * * * * * * * * * * * * Sources for Further Reading: 1. Campbell, , Why Do Chemical Reactions Occur?, Prentice-Hall, Englewood Cliffs, NJ, 1965. (Paperback) 2. Barrow, , Physical Chemistry, McGraw-Hill, New York, 1973. 3. H gg, G., General and Inorganic Chemistry, Wiley, 1969. 4. Henish, H., Roy, R., and Cross, , Phase Transitions, Pergamon, 1973.
2 5. Reisman, A., Phase Equilibria , Academic Press, 1970. * * * * * * * * * * * * * * * * * * * * * * * * * * * * * * * * * * * * * * * * * * * * * * * * * PART A: Phase Equilibria AND Phase DIAGRAMS Phase diagrams are one of the most important sources of information concerning the behavior of elements, compounds and solutions. They provide us with the knowledge of Phase composition and Phase stability as a function of temperature (T), pressure (P) and composition (C). Furthermore, they permit us to study and control important processes such as Phase separation, solidification, sintering, purification, growth and doping of single crystals for technological and other applications.
3 Although Phase diagrams provide information about systems at equilibrium, they can also assist in predicting Phase relations, compositional changes and structures in systems not at equilibrium. 1. GASES, LIQUIDS AND SOLIDS Any material (elemental or compound) can exist as a gas, a liquid or a solid, depending on the relative magnitude of the attractive interatomic or intermolecular forces vs the disruptive thermal forces. It is thus clear that the stability (existence) of the different 1 LN 10 states of aggregation, which are referred to as phases , is a function of temperature and pressure (since with increased pressure the atoms, for exampled of a gas Phase , are closer spaced and thus subject to increased interatomic attraction).
4 In general terms, a Phase is a homogeneous, physically distinct, mechanically separable portion of a material with a given chemical composition. To illustrate this definition, let us look at a few examples of common multi- Phase systems. Ice cubes in water constitute a two- Phase system (ice and liquid water), unless we include the vapor above the glass in our system, which would make it a three- Phase system. A mixture of oil and water would also be a two- Phase system. Just as oil and water represent two distinct liquid phases , two regions of a solid with distinctly different composition or structure separated by boundaries represent two solid phases .
5 If we look at a one-component system, such as liquid water, we recognize that because of the energy distribution of the water molecules, some water molecules will always possess sufficient energy to overcome the attractive forces on the surface of H2O and enter into the gas Phase . If thermal energy is continuously supplied to a liquid in an open container, the supply of high energy molecules (which leave the liquid Phase ) is replenished and the temperature remains constant otherwise the loss of high energy molecules will lower the temperature of the system.
6 The total quantity of heat necessary to completely vaporize one mole of a liquid at its boiling point is called its molar heat of vaporization, designated by HV. Similarly, the heat required to completely melt one mole of a solid (the heat required to break the bonds established in the solid Phase ) is called the (latent) heat of fusion ( HV). Visualize a liquid in a sealed container with some space above the liquid surface. Again, some of the most energetic liquid molecules will leave the liquid Phase and form a gas Phase above the liquid.
7 Since gas molecules will thus accumulate in the gas Phase (at a constant temperature), it is inevitable that as a result of collisions in the gas 2 LN 10 Phase some molecules will re-enter the liquid Phase and a situation will be established whereby the rate of evaporation will equal the rate of condensation , a dynamic equilibrium between the liquid and gas Phase will exist. The established pressure in the gas Phase is referred to as the equilibrium vapor pressure, which is normally significantly less for solids than for liquids.
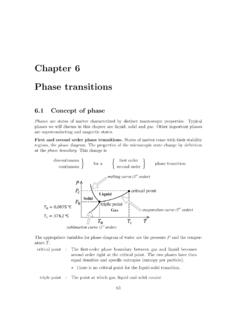
8 For obvious reasons it is desirable to know for any given material the conditions (P, T) under which the solid state, the liquid state and the gaseous state are stable, as well as the conditions under which the solid and liquid phases may coexist. These conditions are graphically presented in equilibrium Phase diagrams, which can be experimentally determined. 2. THE ONE-COMPONENT Phase DIAGRAM Figure 1 illustrates the temperatures and pressures at which water can exist as a solid, liquid or vapor. The curves represent the points at which two of the phases coexist in equilibrium.
9 At the point Tt vapor, liquid and solid coexist in equilibrium. In the fields of the diagram ( Phase fields) only one Phase exists. Although a diagram of this kind delineates the boundaries of the Phase fields, it does not indicate the quantity of any Phase present. It is of interest to consider the slope of the liquid/solid Phase line of the H2O Phase diagram. It can readily be seen that if ice say at 2 C is subjected to high pressures, it will transform to liquid H2O. (An ice skater will skate not on ice, but on water.)
10 This particular pressure sensitivity (reflected in the slope of the solid/liquid Phase line) is characteristic for materials which have a higher coordination number in the liquid than in the solid Phase (H2O, Bi, Si, Ge). Metals, for example have an opposite slope of the solid/liquid Phase line, and the liquid Phase will condense under pressure to a solid Phase . 3 LN 10 Fig. 1 Pressure/Temperature Diagram for Water. (Not drawn to scale.) 3. Phase RULE AND EQUILIBRIUM The Phase rule, also known as the gibbs Phase rule, relates the number of components and the number of degrees of freedom in a system at equilibrium by the formula F = C P + 2 [1] where F equals the number of degrees of freedom or the number of independent variables, C equals the number of components in a system in equilibrium and P equals the number of phases .