Transcription of Archived | Sentencing and Corrections in the 21st Century ...
1 Sentencing and Correctionsin the 21st Century : Setting the Stage for the FutureDoris Layton MackenzieDirector and Professor Evaluation Research GroupDepartment of Criminology and Criminal Justice University of MarylandCollege Park, MDJuly 2001 Archival Notice This is an archive page that is no longer being updated. It may contain outdated information and links may no longer function as originally intended. Archival Notice This is an archive page that is no longer being updated. It may contain outdated information and links may no longer function as originally intended. Archival Notice This is an archive page that is no longer being updated. It may contain outdated information and links may no longer function as originally intended. Archival Notice This is an archive page that is no longer being updated. It may contain outdated information and links may no longer function as originally intended. iContentsGrowth of Correctional among , ethnicity, and Indeterminacy to Crime age of indeterminate Sentencing and time of change: 1970 justice model of Sentencing and control: Incapacitation and in Crime Accounting for the Growth in the Incarceration supervision and of the , cultural, and social changes impinging on the Effectiveness of Different and over : What works in Corrections ?
2 25 Intended and Unintended management and the new on individual consequences for the and community interest in and 1. Incarceration Rates, State and Federal Institutions, 1930 2. Adults on Probation and Parole and in Prison, 1980 3. Rates of Sentenced Prisoners, Selected States, 1980, 1990, 4. Number of People in Prison, on Probation, and on Parole, by Rates, Prisons and Jails, by Race and Gender, 1985 Crime and Incarceration Rates, 1965 7. Discrepancy Between Sentence and Time Served, Comparing StatePrisoners Released From Prison in 1996 With Expected Time Served forNew in State Prison Populations, by Offense, 1980 of Prisoners in Custody of State Correctional Authorities, by Most SeriousCrime, 1980 of Admissions to State Prisons, 1985, 1993, Sentencing Structures, are expressed to Sean Rosenmerkel and Rubie G. Mize for help with this past 30 years have seen enormous changes in the philosophy and practice of Sentencing andcorrections.
3 The strong emphasis on rehabilitation that existed for the first seven decades of the 20thcentury gave way in the 1970s to a focus on fairness and justice, by which sentences reflected justdeserts rather than a utilitarian motive. Sentencing practices later moved toward a crime-control modelthat emphasized incarceration as a way to reduce crime in the community; this crime-control modelbecame increasingly popular during the 1980s and 1990s. Discussion of Sentencing and Corrections inthe 21st Century must begin with a review of these changes and their impact on the criminal historical changes in Sentencing and Corrections policies and practices can be characterized, in part,by the emphasis on different goals. Four major goals are usually attributed to the Sentencing process:retribution, rehabilitation, deterrence, and incapacitation. Retribution refers to just deserts: people whobreak the law deserve to be punished. The other three goals are utilitarian, emphasizing methods toprotect the public.
4 They differ, however, in the mechanism expected to provide public emphasizes the onerousness of punishment; offenders are deterred from committing crimesbecause of a rational calculation that the cost of punishment is too great. The punishment is sorepugnant that neither the punished offender (specific deterrence) nor others (general deterrence)commit crimes in the future. Incapacitation deprives people of the capacity to commit crimes becausethey are physically detained in prison. Rehabilitation attempts to modify offenders behavior andthinking so they do not continue to commit crimes. Although sentences frequently address several ofthese goals in practice, the emphasis on which goal is the highest priority has changed dramatically in thepast 30 the same time the goals of punishment have been changing, the number of people in the UnitedStates who are under correctional supervision has increased enormously. Changes in the practice andphilosophy of Sentencing and Corrections have clearly had a major impact on incarceration , there is no consensus on what, specifically, has caused the changes, the impact of thechanges, or their intended and unintended consequences.
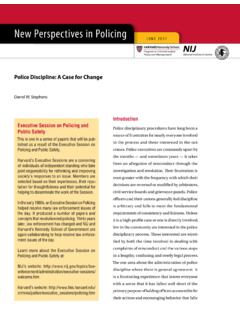
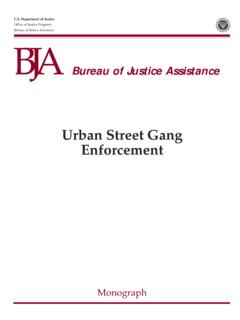
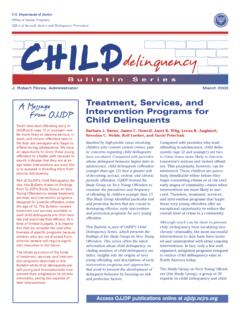
5 This paper explores these of Correctional PopulationsA dramatic increase in offender populations accompanied changes in Sentencing and correctionalphilosophy; this increase was unprecedented and followed a period of relative stability (exhibit 1). From1930 to 1975 the average incarceration rate was 106 inmates per 100,000 adults in the rate fluctuated only slightly, from a low of 93 to a maximum of 137 per 100, This was the ageof indeterminate Sentencing and 1975 incarceration rates grew tremendously; by 1985 the incarceration rate for individuals inState or Federal prisons was 202 per 100,000 adults in the population. The rate continued to grow,reaching 411 in 1995 and 445 in 1997. If local jail populations are also considered, the incarcerationrate in 1997 was 652. By the end of 1998, more than million prisoners were under Federal or Statejurisdiction, and more than million were in jail or 2 Exhibit 2. Adults on Probation and Parole and in Prison, 1980 9705001000150020002500300035001980198219 841986198819901992199419961998 Number of individuals (multiplied by 1,000)ProbationPrisonParoleExhibit 1.
6 Incarceration Rates, State and Federal Institutions, 1930 9805010015020025030035040045050019301935 1940194519501955196019651970197519801985 19901995 Rate (per 100,000 in population)The increases in the correctional populations were not limited to jails and prisons. The number ofindividuals on probation and parole also grew substantially (exhibit 2).3 From 1980 to 1997, thenational correctional population rose from million to million, an increase of 217 percent. Duringthe same period, the probation population grew by 191 percent; parole, 213 percent; and the numberof prisoners, 271 By 1998, more than million adult men and women were on probation orparole, and there were 1,705 probationers and 352 parolees per 100,000 adults in the Source: Bureau of Justice Statistics, Sourcebook of Criminal Justice Statistics, Washington, : department of Justice, Bureau of Justice Statistics, 1999, NCJ 176356; Bonczar, , and Glaze,Probation and Parole in the United States, 1998, Bulletin, Washington, : department of Justice,Bureau of Justice Statistics, August 1999, NCJ 1998 the adult correctional population in Federal, State, and local facilities reached an all-time highof approximately One in 34 adults, or percent of the adult population, were eitherincarcerated or on probation or parole at the end of the The majority of these adults ( ) were on probation or among States The expansion of the prison population affected all State and Federal prisons.
7 However, it is importantto note that the number of individuals in prison or in the community on probation or parole and thechanges over time in these numbers differ greatly by jurisdiction, as shown by the following table ofselected 3. Rates of Sentenced Prisoners, Selected States, 1980, 1990, 1997 STATES198019901997 California 98375484 Georgia 219327492 Illinois 94234353 Louisiana211427709 Minnesota4972117 New York123304384 Texas210290700 Washington106162243*Per 100,000 adult : Bureau of Justice Statistics, Sourcebook of Criminal Justice Statistics,Washington, : department of Justice, Bureau of Justice Statistics, 1999,NCJ incarceration rates in all jurisdictions have increased, the amount of increase, the timing of thechanges, and the 1997 rate vary substantially by jurisdiction. Also, there are significant and relativelystable regional differences in incarceration , ethnicity, and genderOverall, women made up a small percentage of the total correctional population (exhibit 4).
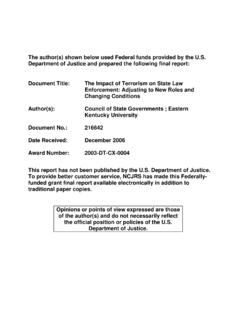
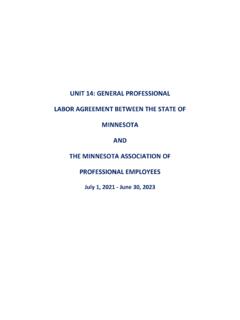
8 However,the incarceration rate for women has grown faster than the rate for men. In 1980 the incarcerationrate for females was 11 per 100,000 women, compared with a rate of 275 for males. By 1999 the rate4 Exhibit 4. Number of People in Prison, on Probation, andon Parole, by Gender01,000,0002,000,0003,000,0004,000, 000On ParoleOn ProbationIn PrisonMenWomenNumber of Peoplefor women had grown to 59 (a 436-percent increase), while the rate for men was 913 (a 232-percentincrease).9 Source: Beck, , Prisoners in 1999, Bulletin, Washington, : department of Justice,Bureau of Justice Statistics, August 2000, NCJ 183476; Bonczar, , and Glaze, Probationand Parole in the United States, 1998, Washington, : department of Justice, Bureau ofJustice Statistics, August 1999, NCJ males had both the greatest overall rate of incarceration and the greatest increases in ratesover time. From 1980 to 1996, the incarceration rate for African-American prisoners in State orFederal prisons grew from 554 to 1,574 per 100,000 adults (a 184-percent increase).
9 10 Alsoduring this time, incarceration rates for Hispanics increased from 206 to 609 (a 196-percent increase);rates for whites rose from 73 to 193 (a 164-percent increase).11 When both prison and jail populationsare calculated, the rates for African-Americans in 1996 were 6,607 and 474 (per 100,000 adultresidents) for males and females, respectively; for whites the rates were 944 for males and 73 Incarceration rates by gender and racial group, as well as the dramatic increase from 1985 to1996 for African-American males, are shown in exhibit ,0001,5002,0002,5003,0003,5004,0004,5005 ,0005,5006,0006,5007,0001985198619871988 19891990199119921993199419951996 Rate (per 100,000 adult residents per group)Black malesWhite malesBlack femalesWhite females Exhibit 5. Incarceration Rates, Prisons and Jails, by Race and Gender,1985 96 Source: Bureau of Justice Statistics, Sourcebook of Criminal Justice Statistics, Washington, department of Justice, Bureau of Justice Statistics, 1999, NCJ expendituresAs a consequence of the enormous growth in correctional populations, the cost of Corrections has alsoincreased.
10 Direct expenditures for correctional activities by State governments grew from $ billionin 1980 to $ billion in Most expenditures supported institutions rather than correctionalprograms such as probation, parole, and community Corrections . Furthermore, the proportion of fundsallocated for institutions continued to grow during this period. In 1980 institutions accounted for of total correctional expenditures, in spite of the fact that the number of probationers wasgrowing more rapidly than the number of prisoners. By 1994 institutional spending made up of correctional costs. Expenditures for other correctional programs were reduced from percent during the same period. Overall, the cost of keeping inmates in institutions is much greater than the cost of communitysupervision. In 1996 the average annual operating expenditure per inmate in State prisons was$20,100. The annual per-inmate costs of regular probation and parole supervision are estimated to beabout $200 for probation and $975 for an annual cost per resident, total State correctional spending rose from $53 in 1985 to $103 Although annual spending for prisons increased at a greater rate than other areas of Statebudgets, Corrections relative share of the total outlay remained small.