Transcription of Atlas of Childhood Obesity
1 Atlas of Childhood Obesity October 2019. Comprising Tables of Country Rankings 191 Country Report Cards Showing highest and lowest 20 countries With national Childhood Obesity risk scores and in several measures probability of meeting the WHO 2025 targets Compiled by Tim Lobstein and Hannah Brinsden World Obesity Federation . Charles Darwin 2, 107 Gray's Inn Road, London, WC1 X8TZ. We are grateful to the World Health Organization, UNICEF. and the NCD Risk Collaboration (NCD-RisC) for the data we have used in this Atlas . Please refer to page 210 of this Atlas for the data sources.
2 World Obesity Federation 2019. Atlas of Childhood Obesity 2. Atlas of Childhood Obesity Contents Page Foreword 4. Introduction 5. Tables of Country Rankings 6. Predicted numbers of children with Obesity in 2030 7. Country Rankings (highest and lowest 20) 8-13. Country Report Cards 14. Country List 15. Country Report Cards 17-207. Appendix 208. Colour-coding Definitions 209. Data Sources 210. Atlas of Childhood Obesity | Contents 3. Foreword Welcome to this, our first Atlas of Childhood Obesity , showing details of Childhood Obesity , risk factors and policies for virtually every country worldwide.
3 We also show the likelihood of meeting the globally agreed target of no increase in Childhood Obesity prevalence by 2025'. and our assessment of the risk for each country of having or acquiring a high proportion of children Donna Ryan living with Obesity over the coming decade. President What gets measured gets done is commonly cited as a justification for monitoring progress, and lies behind our publication of this Atlas . There is no doubt that a lack of measurement makes it very hard to assess the impact of any interventions, and may lead to nothing being done.
4 But equally, measurement alone is no guarantee of progress. Without substantial interventions to prevent and to treat Childhood Obesity , the numbers of school-age children and adolescents living with Obesity is predicted to rise from the current estimates of around 150m worldwide, to over 250m by 2030. Obesity in Childhood is closely associated with Obesity in adulthood, and with more years living with Obesity , both of which are linked to a high level of consequential disease. The continuing increase in Childhood Obesity will overwhelm the Johanna Ralston health services of many countries.
5 The increase shows a critical Chief Executive failure of government to respect and protect our children's rights to good health. We can do better, and we must. Atlas of Childhood Obesity | Foreword 4. Introduction This Atlas of Childhood Obesity This present Atlas is the first provides the latest estimates of of its type. It is launched as UN agencies are compiling infant, child and adolescent Obesity a mid-term review of prevalence in 191 countries. progress on the United Nations Decade of Action It also provides estimates of the prevalence and on Nutrition (2016-2025), numbers of children living with Obesity in 2030, to be tabled at the United along with an estimate of the probability of Nations General Assembly achieving the World Health Organization (WHO).
6 In December 2019. target of no increase in Obesity prevalence by 2025' on the assumption that present We are indebted to the trends continue. NCD Collaboration , and especially James Bentham, for assistance in As some countries may have a low level of providing predictions for future Childhood Childhood Obesity prevalence yet fail to prevent Obesity around the world. Both we and it climbing before 2025, the World Obesity the Collaboration earnestly hope that the Federation (WOF) has calculated a risk score'. predictions turn out to be wrong, and that for each country's likelihood of having or policies are enacted to ensure that far fewer acquiring a major Childhood Obesity problem children are living with Obesity by the year 2030.
7 During the 2020s, taking account of current prevalence levels and risk for future Obesity Tim Lobstein (based on stunting among infants, maternal Hannah Brinsden Obesity , maternal smoking, and breastfeeding rates). Throughout the Atlas we have used colour- coding to indicate worse (red), moderate (amber) or better (green) levels for each of the indicators shown. Details for the colour-coding thresholds are given in the Atlas appendix. Note: The Atlas follows the 2018 joint WHO-WOF In this document we use the term infants' to publication of Taking Action on Childhood refer to children aged 0-5 years old.
8 Obesity wof- and We use the term Obesity ' to refer to a body continues our commitment to monitor and mass index (BMI) at least two standard promote the recommendations of the WHO deviations above the mean, based on Commission on Ending Childhood Obesity the World Health Organization's growth standards and reference tables (https://www. publications/echo-plan-executive-summary /en/. ). Atlas of Childhood Obesity | Introduction 5. Tables of Country Rankings Atlas of Childhood Obesity | Tables of Country Rankings 6. Predicted numbers of children with Obesity in 2030.
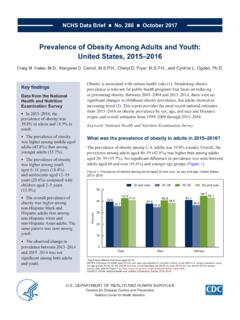
9 Numbers of children age 5-19 years old living with Obesity , predicted for the next decade. Year 2020 2025 2030. World 158m 206m 254m Countries predicted to have over 1 million school-age children and youth living with Obesity in 2030. Number of Number of persons with persons with Country Country Obesity , aged Obesity , aged 5-19, 2030 5-19, 2030. China 61,987,920 Vietnam 1,939,173. India 27,481,141 Ethiopia 1,926,697. United States of America 16,986,603 Saudi Arabia 1,864,250. Indonesia 9,076,416 Malaysia 1,770,631. Brazil 7,664,422 Sudan 1,757,471.
10 Egypt 6,818,532 Morocco 1,757,152. Mexico 6,550,276 Yemen 1,646,485. Nigeria 6,020,182 Venezuela 1,611,444. Pakistan 5,412,457 Colombia 1,583,123. South Africa 4,146,329 Syrian Arab Republic 1,552,255. Bangladesh 3,555,050 Kenya 1,463,954. Iraq 3,477,305 France 1,368,893. Turkey 3,389,941 Uganda 1,345,197. Philippines 3,376,420 Germany 1,318,415. Iran 3,023,603 United Kingdom 1,309,702. Algeria 2,703,722 Italy 1,307,765. Russian Federation 2,550,607 Myanmar 1,288,929. DR Congo 2,421,404 Afghanistan 1,286,177. Argentina 2,248,509 Guatemala 1,262,281.