Transcription of Australian Life Tables 2005-07 - Australian …
1 Australian life Tables 2005 -07 Commonwealth of Australia 2009 ISBN 978-0-642-74561-3 This work is copyright. Apart from any use as permitted under the Copyright Act 1968, no part may be reproduced by any process without prior written permission from the Commonwealth available from the Australian Government Actuary. Requests and inquiries concerning reproduction and rights should be addressed to: Australian Government Actuary Department of the Treasury Treasury Building Langton Crescent CANBERRA ACT 2601 Or by email to: Printed by CanPrint Communications Pty Ltd iii CONTENTS DEFINITIONS OF 1 1.
2 MORTALITY OF THE Australian 3 Results for 2005 -07 ..3 Changes since Past improvements in mortality ..8 Allowing for future improvements in Australian life Tables 2005 -07: 22 Australian life Tables 2005 -07: 24 2. CONSTRUCTION OF THE Australian life Tables 2005 -07 .. 26 Calculation of exposed-to-risk and crude mortality rates ..26 Graduation of the crude mortality rates ..30 Calculation of life table functions ..34 3. USE OF life Tables FOR PROBABILITY 35 APPENDIX 38 APPENDIX 42 APPENDIX 44 APPENDIX 46 APPENDIX E .. 50 iv LIST OF FIGURES FIGURE 1: MORTALITY RATES 3 FIGURE 2: RATIO OF MALE TO FEMALE MORTALITY RATES 5 FIGURE 3: MORTALITY RATES 2000-02 AND 6 FIGURE 4: PERCENTAGE IMPROVEMENT IN MORTALITY SINCE 7 FIGURE 5: RATIO OF MALE TO FEMALE MORTALITY RATES AGES 20 TO 100 2000-02 AND 2005 -07.
3 8 FIGURE 6: IMPROVEMENTS IN MORTALITY AT SELECTED 9 FIGURE 7: TOTAL life EXPECTANCY AT SELECTED 12 FIGURE 8: GENDER DIFFERENTIALS IN life EXPECTANCY AT SELECTED 13 FIGURE 9: SMOOTHED MORTALITY RATES FROM 1881-90 TO THE PRESENT AGES 10 TO 14 FIGURE 10: HISTORICAL MORTALITY IMPROVEMENT FACTORS DERIVED FROM THE Australian life 16 FIGURE 11: ACTUAL AND PROJECTED PERIOD life EXPECTANCY AT BIRTH 1966 TO 2056 .. 18 FIGURE 12: COHORT life EXPECTANCIES BY CURRENT 20 FIGURE 13: COMPARISON OF CENSUS POPULATION COUNT AND 29 FIGURE 14: CRUDE CENTRAL MORTALITY 31 v DEFINITIONS OF SYMBOLS Australian life Tables 2005 -07 sets out the following functions.
4 Xl = the number of persons surviving to exact age x out of 100,000 births xd = the number of deaths in the year of age x to (x + 1) among the xl persons who are alive at the beginning of that year xp = the probability of a person aged exactly x surviving the year to age (x + 1) xq = the probability of a person aged exactly x dying before reaching age (x + 1) x = the force (or instantaneous rate) of mortality at exact age x oxe = the complete expectation of life (that is, the average number of years lived after age x ) of persons aged exactly x xL = the total number of years of life experienced between age x and (x + 1) by xl persons aged exactly x xT = the total number of years of life experienced after age x by xl persons aged exactly x NOTE: Figures in the Tables are rounded and hence the usual identities between these functions may not be satisfied exactly.
5 1 INTRODUCTION This publication presents the Australian life Tables 2005 -07 (the Tables ), which are based on the mortality of Australians over the three year period centred on the 2006 Census of Population and Housing (the Census). This publication discusses the major features of the 2005 -07 life Tables with particular reference to the previous Australian life Tables . Mortality improvement factors have been calculated based on the improvements observed over the past 25 and 100 years. The impact of mortality improvement on life expectancies is explored in the context of these two scenarios.
6 This discussion is followed by the Tables themselves, together with the technical notes on their construction. The appendices include supporting information referred to in the text. The Tables are also available on the AGA website ( ) together with past mortality rates and life expectancies and the mortality improvement factors referred to in the body of the report. This is the seventeenth in the series of official Australian life Tables . Tables for the years 1881-90, 1891-1900, 1901-10, 1920-22 and 1932-34 were prepared by the Commonwealth Statistician. The first three Tables took into account deaths over a ten year period and each table incorporated information from two censuses.
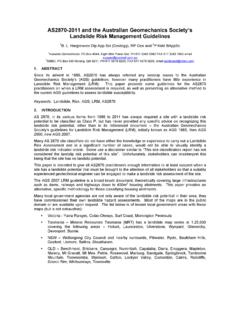
7 All subsequent Tables have been based on deaths and estimates of population over a period of three years centred on a Census. The Tables for the years 1946-48 and 1953-55 were prepared by the Commonwealth Actuary. Tables since 1960-62 have been produced quinquennially by the Australian Government Actuary (under the former title of Commonwealth Actuary in the case of the earlier Tables ). P. Martin FIAA Australian Government Actuary November 2009 3 1. MORTALITY OF THE Australian POPULATION Results for 2005 -07 Figure 1 shows the mortality rates reported in the 2005 -07 life Tables on a logarithmic scale.
8 Figure 1: Mortality rates 2005 -07 (logarithmic scale)qx(logarithmic scale) The pattern of mortality observed in Figure 1 is typical of Western countries. Mortality rates during the first few years of life are high due to the vulnerability of infants to disease. The rates quickly improve with age as resistance builds. Around age 9 or 10, mortality rates reach a minimum. At this point, the probability of dying within the year is around 1 in 10,000. The steep rise in mortality rates during the teenage years is primarily due to accidental deaths and is more pronounced for males than females.
9 Mortality rates increase only slowly during the twenties and into the middle thirties. Accidental death rates decline with increasing age but this decline is offset by an increase in rates of death due to disease. The shape of the curves around ages 18 to 21 has not changed much since the 2000-02 Tables , when the previous accident hump flattened for the first time in several decades. 4 It can be argued that the underlying mortality process arising from normal biological ageing can be approximately represented by an exponential function (that is, a plot of mortality rates will appear as a straight line on a logarithmic scale).
10 By fitting such a function between the point of minimum mortality to the point where the observed mortality is roughly exponential (age 47 for males and age 34 for females in the current Tables ), it is possible to calculate the excess mortality due to abnormal factors over the twenties and thirties. The 2005 -07 Tables suggest that the excess mortality over these years is of the order of 1,300 deaths per annum for males and 200 deaths per annum for females based on the population profile for the three years covered by the Tables . For males in particular, this is a significant reduction from the comparable figure of 1,800 reported in the 2000-02 Tables The shapes of the mortality curves for males and females are quite similar, but the absolute rates are significantly different with female mortality being substantially less than male mortality at all but the very oldest ages.